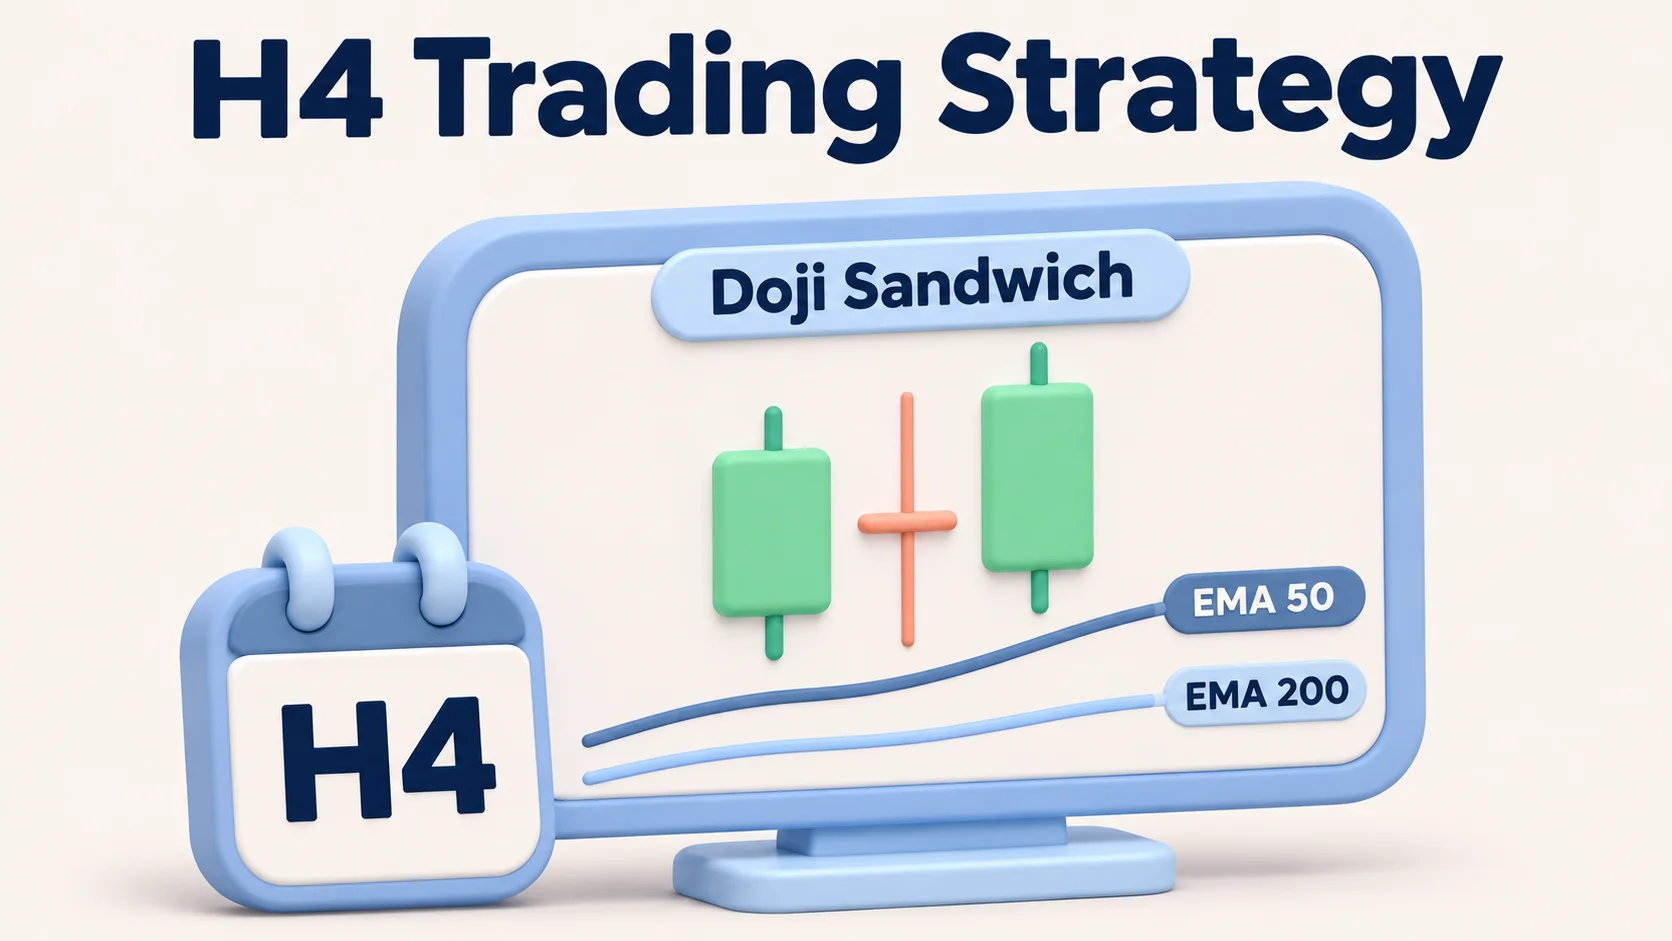
A three-candle setup on an H4 chart can look convincing, but an entry still needs defined conditions and risk controls. An H4 trading strategy uses completed four-hour candles to assess setups, set invalidation levels, and weigh potential reward against risk. Two tools can make that decision more specific: the 50- and 200-period exponential moving averages (EMAs) for trend context, and a three-candle Doji Sandwich for a possible entry.
In the variation used here, a bullish Doji Sandwich consists of a directional bullish candle, a middle candle whose opening and closing prices are nearly equal, and another bullish directional candle that closes above the Doji's high. In a bearish version, the outer candles point down and the third closes below the Doji's low. The pattern may indicate a pause followed by renewed momentum, but its meaning depends on the surrounding trend, nearby levels, and execution costs.
The strategy settings and synthetic GBP/USD example are educational illustrations; they do not establish a verified win rate or historical profitability.
H4 strategy at a glance
Here, 1R is the planned price distance between the order trigger and protective stop, measured on the relevant entry and exit quote sides. A 2R target is twice that distance in the favorable direction, before trading costs and slippage.
| Element | Strategy rule | Why it matters |
|---|---|---|
| Market and chart | GBP/USD or another single selected forex pair, H4 candles | Consistent data and spread assumptions |
| Trend filter | EMA(50) above EMA(200), rising EMA(200), and third candle above EMA(50) for buys; mirror for sells | Avoids treating every Doji as a reversal |
| Pattern | Directional candle → Doji → same-direction candle, using the body-to-range rules below | Defines which three-candle formations qualify |
| Confirmation | Third H4 candle closes beyond the Doji's high for buys or low for sells | Avoids acting on an unfinished candle |
| Entry | Buy Stop 2 pips above the third candle's high or Sell Stop 2 pips below its low; valid for the next two H4 candles. Under standard OTC forex quote conventions on Bid-based charts, the Buy Stop trigger is Ask and the Sell Stop trigger is Bid. | Makes order timing measurable |
| Stop | 4 pips below the lowest formation Bid low for longs; 4 pips above the highest formation Ask high for shorts. Evaluate each stop on its stated quote side. | Specifies invalidation before entering |
| Target rule | If a qualifying opposing level exists, more than 2R of room to the nearest confirmed H4 or daily swing within the prior 100 completed bars on each timeframe, comparing level and target on the same exit quote side | Avoids forcing an arbitrary target through a nearby level |
| Position size | Derived from cash risk, pip value, and entry-to-stop distance | Limits planned risk, not guaranteed loss |
The fixed pip buffers are specific to this example and may not suit pairs with different spreads or volatility.
What does H4 mean in forex trading?
H4 means a four-hour chart interval. Each completed candle shows the opening, highest, lowest, and closing prices over four hours. There are six four-hour periods in 24 hours, but market closures, broker time settings, and partial sessions can alter the bars displayed around the beginning and end of a trading week.
An H4 chart can reveal a pause or retracement that is difficult to distinguish from short-term noise on a five- or 15-minute chart. Its trade-off is that signals arrive less frequently, and a position can remain exposed through news, thin liquidity, rollover, or the weekend. That makes H4 a timeframe used for some forms of forex swing trading, not a guarantee that it is safer than shorter-term trading.
Here, H4 serves as the decision chart. The EMAs, Doji measurements, confirmation and entry deadline are all calculated from completed H4 bars. Adding a separate daily trend filter or H1 entry confirmation would change the strategy; confirmed daily swing levels are already part of the baseline target-room check.
Set up the H4 chart and 50/200 EMA filter
Open an H4 candlestick chart and add two exponential moving averages calculated from closing prices:
- EMA(50): the faster line, reflecting more recent H4 closes.
- EMA(200): the slower line, summarizing a longer period of H4 closes.
An EMA gives more weight to recent prices than a simple moving average. It is a lagging calculation of historical prices, not a forecast.
For long setups, the example requires EMA(50) above EMA(200), with the current completed EMA(200) value above its value 10 completed H4 candles earlier. The third candle must also close above EMA(50). For short setups, reverse all three conditions. If the EMA order or the 10-bar slow-EMA slope condition fails, the setup produces no trade.
Use this as a market-condition check, not a buy signal on an EMA crossover. Crossovers can whipsaw, while waiting for a later pattern may miss a move.
How to identify a Doji Sandwich on the H4 chart
A Doji is a candle whose opening and closing prices are unusually close together relative to its full high-to-low range. It reflects little net change between open and close, not proof that buyers and sellers are equally strong or that a reversal must follow.
The term Doji Sandwich can describe different three-candle arrangements. Here it refers to a specific three-bar variation, defined by the numerical rules in this section.
Use this explicit three-bar definition:
- First candle — directional: the real body (absolute close minus open) is at least 50% of its high-to-low range. It closes higher than it opens for a bullish setup or lower for a bearish setup.
- Middle candle — Doji: the real body is no more than 10% of the full candle range.
- Third candle — directional confirmation: its real body is at least 50% of its range, and it closes in the same direction as the first candle. For a long, it also closes above the Doji high; for a short, below the Doji low.
All three candles must be fully closed and have a nonzero high-to-low range. A small-bodied Doji can still have long wicks, creating a wide stop. Position-size and target-room checks determine whether the setup remains practical. No additional subjective Doji-size filter applies.
The diagram shows a possible bullish continuation, not a certain reversal. This sequence can also form after a decline or in a range; the EMA filter favors an established uptrend. Countertrend formations do not qualify under these rules.
Bullish H4 trading strategy: exact entry and exit rules
A long candidate becomes actionable only after the trend and all three pattern candles meet their requirements.
Step 1: Confirm the upward EMA regime
At the third candle’s close, verify the bullish EMA regime defined above using completed bars, not moving indicator values from an unfinished candle.
Step 2: Measure all three candles
Calculate real-body ratio = |close − open| ÷ (high − low) for each candle. Exclude zero-range candles, apply the outer-candle 50% and Doji 10% thresholds defined above, and confirm that the third candle closes beyond the Doji high.
Step 3: Check the price structure and target room
Use a fixed, objective structure rule. For a long, identify the nearest confirmed swing high above the planned entry price; for a short, identify the nearest confirmed swing low below the planned entry price. Across H4 and daily candidates, “nearest” means closest by price (above the long entry or below the short entry), not most recent in time. If multiple pivots share the same nearest Bid level, select the most recently confirmed one; for shorts, this also identifies which pivot bar supplies the historical Ask low. A confirmed H4 or daily swing high is a bar whose high is strictly greater than the highs of the two completed bars immediately before and after it; a swing low is defined by a low strictly below the lows of those four surrounding bars. Recognize a swing only after the two bars to its right have closed. Search the prior 100 completed bars on each timeframe (H4 and daily), excluding incomplete daily candles and using only levels already confirmed when the signal forms.
Compare the planned 2R target and the opposing level on the same exit quote side. For a long, compare the Bid-price target with the Bid-chart swing high. For a short, use the historical Ask low of the selected Bid-defined swing-low pivot bar as the comparable support level for the Ask-price target. If the nearest swing high is at or below the planned long target, or the corresponding Ask low is at or above the planned short target, skip the trade. A short-side comparison needs synchronized historical Ask data; do not substitute the Bid low or a current spread if those prices are unavailable.
If neither timeframe has a qualifying opposing swing within its 100-bar lookback, record that none was found and apply no additional structure restriction.
Step 4: Place a conditional entry, not a market chase
Submit the pending order immediately after the third H4 candle closes. For a long, place a buy-stop trigger 2 pips above the third candle's high; for a short, place a sell-stop trigger 2 pips below its low. In MetaTrader 5's standard OTC forex setup, H4 candles are Bid-based: a Buy Stop triggers when Ask reaches its trigger, while a Sell Stop triggers when Bid reaches its trigger. The long rule is therefore an Ask-price trigger measured from the Bid-chart high, not proof that the Bid price has broken that level. Confirm the quote and trigger conventions for the broker and instrument. If the relevant executable quote is already at or beyond the trigger when the order can be submitted, skip the trade rather than chase it.
Cancel an untriggered order at the close of the second completed H4 candle after the signal. In this baseline, a move through the proposed stop level before entry does not cancel the pending order. Process triggers and expiry in timestamp order; a stop order becomes a market order when triggered and may fill at the trigger price or worse, particularly during a gap or fast market.
Step 5: Place the stop beyond the formation
For a long, set the protective stop 4 pips below the lowest Bid-chart low of the three candles. For a short, set the Ask-price protective stop 4 pips above the highest observed Ask high across the same three H4 periods, using synchronized Bid/Ask history. The short buffer is therefore measured beyond the formation's Ask extreme, not the Bid-chart high. Bid-only OHLC history cannot verify that Ask extreme.
In standard OTC forex MetaTrader 5 execution, a long stop is checked against Bid and a short stop against Ask; a chart touch alone does not guarantee the exit fill. These stops define structural invalidation, not a maximum loss. Round calculated lots down to the permitted volume increment. Skip a trade if rounded volume is below the broker's minimum, the stop breaches minimum-distance rules, or margin is insufficient.
Step 6: Size the position and set the planned exit
Determine the gross price-risk allowance first, then calculate lots as gross cash risk allowance ÷ (stop distance in pips × pip value per standard lot in the account currency). If the intended all-in risk budget includes commissions or a planned execution allowance, reserve those costs before sizing and check the total again at the rounded volume. Verify the contract specifications and pip value with the broker.
For the baseline version, calculate the intended target at 2R from the pending order's trigger price and initial stop level, using the executable quote side for each leg, and place it if no opposing swing level is found or if the target is strictly before the nearest confirmed one on the relevant exit quote side (Bid for a long, Ask for a short). Keep that target fixed after entry; if the actual fill slips, report the resulting realized reward-to-risk ratio rather than moving the target to restore 2R.
The baseline allows only one active pending entry order or open position per pair. Ignore new signals until the pending order is canceled or expires, or the resulting position closes. There is no time-based, opposite-signal, or trailing-stop exit. Hold until the initial protective stop or target executes.
Bearish H4 strategy: reverse the setup without changing the logic
The short candidate uses the mirror image of the long rules:
- EMA(50) is below EMA(200), EMA(200) is lower than it was 10 completed H4 candles earlier, and the third candle closes below EMA(50).
- The first and third candles are bearish, with bodies of at least 50% of their ranges; the middle candle is a Doji at or below the 10% body ratio.
- The third candle closes below the Doji's low.
- The nearest confirmed support level, compared on the Ask side using the Ask low of the selected Bid-defined swing-low bar, must lie strictly beyond the planned 2R Ask-price target; if no qualifying opposing swing is found, the baseline applies no additional structure restriction.
- A sell-stop is set 2 pips below the third candle's low, with a two-H4-candle expiry.
- The Ask-price stop is placed 4 pips above the highest observed Ask high across the three-bar formation; the Ask-price target is 2R below the planned Bid entry if structure permits.
A bearish sandwich with bullish EMA alignment is not a short setup under these rules. Countertrend entries or entries at the third candle's close fall outside these rules.
Worked example: hypothetical GBP/USD H4 Doji Sandwich
Assume GBP/USD is in an upward H4 EMA regime. For illustration, EMA(50) is 1.2670, EMA(200) is 1.2630, and EMA(200) ten completed H4 bars earlier was 1.2615; the third candle closes above EMA(50). Also assume the nearest confirmed opposing swing high found under the H4/daily pivot rule is 1.2830, leaving the planned 2R target at 1.2800 below that level. The following synthetic H4 OHLC values are Bid prices, not historical broker quotes.
| H4 candle | Open | High | Low | Close | Body / range |
|---|---|---|---|---|---|
| 1 — bullish | 1.2660 | 1.2690 | 1.2657 | 1.2684 | 0.0024 / 0.0033 = 72.7% |
| 2 — Doji | 1.2683 | 1.2691 | 1.2654 | 1.2684 | 0.0001 / 0.0037 = 2.7% |
| 3 — bullish | 1.2682 | 1.2698 | 1.2671 | 1.2697 | 0.0015 / 0.0027 = 55.6% |
The third candle closes at 1.2697, higher than the Doji high of 1.2691, so the pattern meets the bullish confirmation rule. Its Bid-chart high is 1.2698; the buy-stop trigger is set at 1.2700 Ask, two pips above that Bid high. Assume an illustrative one-pip spread at order submission, giving an Ask quote of 1.2698. The pending order is therefore above the current Ask, provided the broker's minimum order distance permits it; if Ask has already reached or exceeded 1.2700, skip the setup. The trigger is an Ask price, not a guarantee that the Bid chart will print 1.2700.
The lowest Bid low in the formation is 1.2654, on the Doji. The long protective stop is therefore set at 1.2650 Bid. The planned distance from the 1.2700 Ask trigger to the 1.2650 Bid stop is 50 pips (0.0050); because it already compares the executable entry and exit quote sides, do not add the same spread again to this distance. A 2R target is 1.2800 Bid, 100 pips above the planned entry. The assumed nearest opposing swing high at 1.2830 lies beyond that target.
Calculate the position size from cash risk
Suppose the demo account has a $12,000 USD balance and the hypothetical gross price-risk allowance is 0.5%, or $60, before commissions and slippage. For GBP/USD quoted in USD, a 100,000 GBP standard lot changes by $10 for each 0.0001 price move (one pip), assuming the conventional contract size and a USD account.
Lots = gross price-risk allowance ÷ (stop in pips × USD per pip per standard lot)
$60 ÷ (50 × $10) = 0.12 standard lots, equal to 12,000 GBP of notional base-currency size.
At 0.12 lots, pip value is $1.20. A 50-pip move to the intended stop is $60 of gross price-movement loss; a 100-pip move to the intended target is $120 of gross price-movement gain. Those are planned outcomes, not maximum-loss or profit guarantees. If $60 is intended as an all-in planned-loss budget instead, reserve estimated round-trip commissions and any predeclared execution allowance before sizing, then round down and recheck the estimated total. For other pairs or account currencies, pip value must be converted correctly before calculating position size.
What happens if the order fills worse than planned?
A buy stop triggered at 1.2700 Ask could fill at 1.2705 Ask during fast trading. With the long protective stop still at 1.2650 Bid, the effective entry-to-stop distance is then 55 pips, not 50. At the unchanged 0.12 lot size, the estimated gross price-movement loss would be $66, before additional costs. The unchanged 1.2800 Bid target now offers 95 pips, so the gross reward-to-risk ratio falls to 95 ÷ 55 = approximately 1.73R, not 2R. If the $60 gross price-risk allowance were sized against a 55-pip distance in advance, the theoretical volume would be $60 ÷ (55 × $10) = approximately 0.109 standard lots before costs; the broker's volume increment would require rounding down. If the stop exit itself slips, the realized loss can be larger still.
Doji Sandwich versus an EMA-only H4 pullback
The three-candle strategy and an EMA pullback share a trend filter but answer different entry questions.
| Feature | EMA-filtered Doji Sandwich | EMA-only H4 pullback |
|---|---|---|
| Setup | Specific three-candle sequence | Retracement toward a chosen EMA zone |
| Confirmation | Doji-body measurement and third-candle close | Predetermined price reclaim or rejection of the EMA |
| Trigger | Break beyond the third candle's extreme | Break beyond a separately specified signal candle |
| Stop reference | Highest high or lowest low of the three-candle formation | Pullback swing high or low |
| Main challenge | Few eligible patterns; occasional very wide Doji | Repeated touches in sideways markets |
An EMA-only approach might wait for price to approach EMA(50), close back with the trend, and break a signal candle's high or low. It still needs separate definitions of “approach,” entry, stop, target, and expiry. This is a different setup, not an alternative entry within the Doji Sandwich rules.
When to avoid an H4 entry
Even a textbook-looking pattern may not justify an entry. The following are no-trade conditions under these rules or practical considerations before entering a position:
- Flat or crossed EMAs: the required directional regime is absent.
- Position size or broker constraints: rounded volume is below the broker's minimum, the stop breaches minimum-distance rules, or margin is insufficient. No additional maximum-stop threshold applies.
- Insufficient room to the next level: when a qualifying opposing swing is found, skip the trade if that level is at or inside the 2R target on the relevant exit quote side. Use the H4/daily pivot rule defined above.
- Incomplete candle: the third candle has not closed; its apparent body and breakout may disappear.
- Expired or overlapping entry: the pending order expires or another order or position is already active on the pair.
- Optional spread, liquidity, or news filter: these are not automatic exclusions in the baseline. Check prevailing spreads, liquidity, and scheduled news before live trading; additional filters should have clear, consistent rules. Account for actual trading costs when assessing exposure.
- Weekend and rollover exposure: a position may remain open when spread and financing conditions change. Check the broker's trading hours, rollover schedule, and financing terms.
H4 candle closing times and MT4/MT5 settings
A four-hour candle does not close at the same local-clock time on every forex chart. On a platform where bars are anchored to server midnight, the standard H4 boundaries are 00:00, 04:00, 08:00, 12:00, 16:00, and 20:00 server time. Your local time can differ, and the displayed historical candles can differ across brokers. In addition, forex trading hours and some instruments' schedules can be interrupted around weekends and holidays.
Before using the strategy, check the broker's server time, selected symbol, chart type, exact H4 candle boundaries, quote basis, and order specifications. The Bid/Ask entry and exit rules explained above reflect standard OTC forex conventions; confirm them for the broker and instrument.
This matters for a three-candle setup: changing the H4 boundary can change which price action falls into the first, Doji, and third bars, producing different setups across broker charts.
Common H4 strategy mistakes
Calling every small candle a Doji. A small body on an unusually large range may create a very different risk profile. Use the specified body-to-range calculation rather than a visual guess.
Taking the third candle before it closes. Its body can shrink or reverse during the final minutes. If the rule requires a completed close beyond the Doji high or low, an unfinished bar is not a signal.
Treating EMAs as support that must hold. Price can cross a moving average repeatedly; the EMA itself does not create a guaranteed defense or target.
Entering too far beyond the proposed price. A stop-entry fill can slip during volatility. Chasing after the entry deadline changes the setup and the projected R multiple.
Using fixed lots for every trade. A 25-pip stop and an 80-pip stop produce different cash exposure at the same lot size. The permitted cash risk should determine lots, not available leverage.
Ignoring the portfolio. Two positions on correlated GBP or USD pairs can lose together. Per-trade position sizing alone does not prevent total exposure from becoming excessive; set an aggregate exposure limit for correlated positions as well as a per-trade risk limit.
Final takeaway
An H4 Doji Sandwich is best treated as a conditional setup within a defined trend, not a reason to trade whenever three familiar candles appear. The 50/200 EMAs specify the market regime; the pattern defines the trigger; and the formation's extreme determines the planned invalidation. If the target is blocked, the entry is late, or the order would exceed the permitted cash risk, the rule is to stand aside.
Risk warning: Leveraged forex and related products involve a substantial risk of loss. Stop orders, position sizing and planned reward-to-risk ratios cannot guarantee the price of an execution or cap realized losses when markets gap or liquidity disappears. The charts, GBP/USD candles, and numerical trades are hypothetical and are for general education, not personal financial advice. Check the broker's regulatory status, product protections, and order mechanics before trading.
FAQs
What is an H4 trading strategy?
An H4 strategy uses completed four-hour candles to plan entries, define stops and targets, and review positions. In the example above, 50/200 EMAs filter the market regime and a completed three-candle Doji Sandwich provides the potential trigger.
What is a Doji Sandwich pattern in forex?
A Doji Sandwich is a small-bodied Doji between two directional candles. In this setup, the first and third candles point in the same direction with bodies at least 50% of their ranges, the Doji body is no more than 10% of its range, and the third candle closes beyond the Doji high or low.
Does a Doji Sandwich predict a reversal?
No. It can appear as a pause within a trend or around a turning point, and false signals occur. In this setup, the EMA trend filter must agree with the pattern; countertrend reversals fall outside these rules.
Which EMA settings are used for the H4 strategy?
The illustrative setup uses EMA(50) and EMA(200) on completed H4 closing prices. It requires the 50 EMA to be above or below the 200 EMA, a directional 200 EMA slope over 10 H4 bars, and the third candle to close on the appropriate side of EMA(50).
Where should an H4 Doji Sandwich stop-loss go?
For this setup, a long stop is four pips below the lowest Bid low of the three-bar formation. A short stop is four pips above the highest observed Ask high across the same three H4 periods, using synchronized Bid/Ask data. On platforms using standard OTC forex quote conventions, long stop-loss conditions are checked against Bid and short stop-loss conditions against Ask. A stop does not guarantee the exit price or cap losses during gaps or slippage.
How do you calculate position size on an H4 trade?
Calculate lots as the gross price-risk allowance divided by (stop distance in pips multiplied by pip value per standard lot in the account currency). In the hypothetical GBP/USD example, $60 ÷ (50 pips × $10 per pip per standard lot) = 0.12 standard lots before commissions or slippage. If $60 is an all-in planned-risk budget, reserve expected costs before sizing. Round volume down to the broker’s permitted increment.
Can I trade the H4 strategy on MT4 or MT5?
Yes, either platform can display H4 candles and moving averages, subject to broker support. Check the broker’s chart quote basis and order specifications. On platforms using standard OTC forex quote conventions, charts commonly use Bid prices, Buy Stops trigger on Ask, Sell Stops on Bid, long stop-loss/take-profit conditions use Bid, and short stop-loss/take-profit conditions use Ask. Confirm the corresponding behavior for your broker and instrument.

Stephen Bennet
Stephen Bennet is a Forex reviewer and financial analyst with more than 25 years of experience in the financial markets. He specializes in reviewing brokers, evaluating trading platforms, and explaining the Forex market in a clear and practical way. Through independent, trader-focused analysis, Stephen helps readers compare providers, understand key risks, and choose platforms with greater confidence.