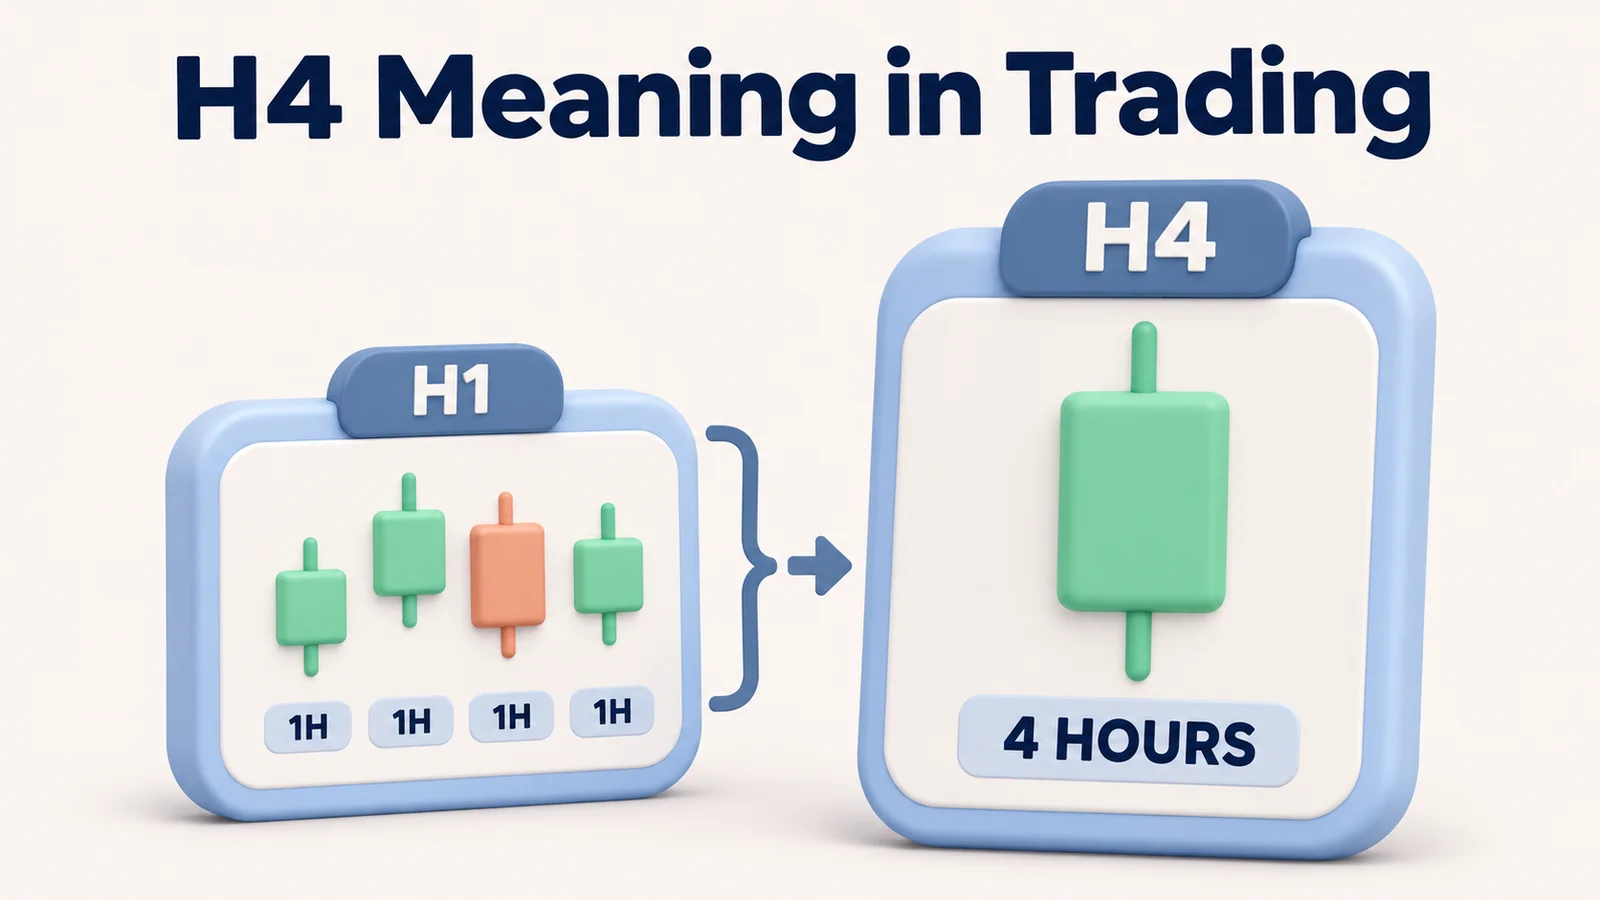
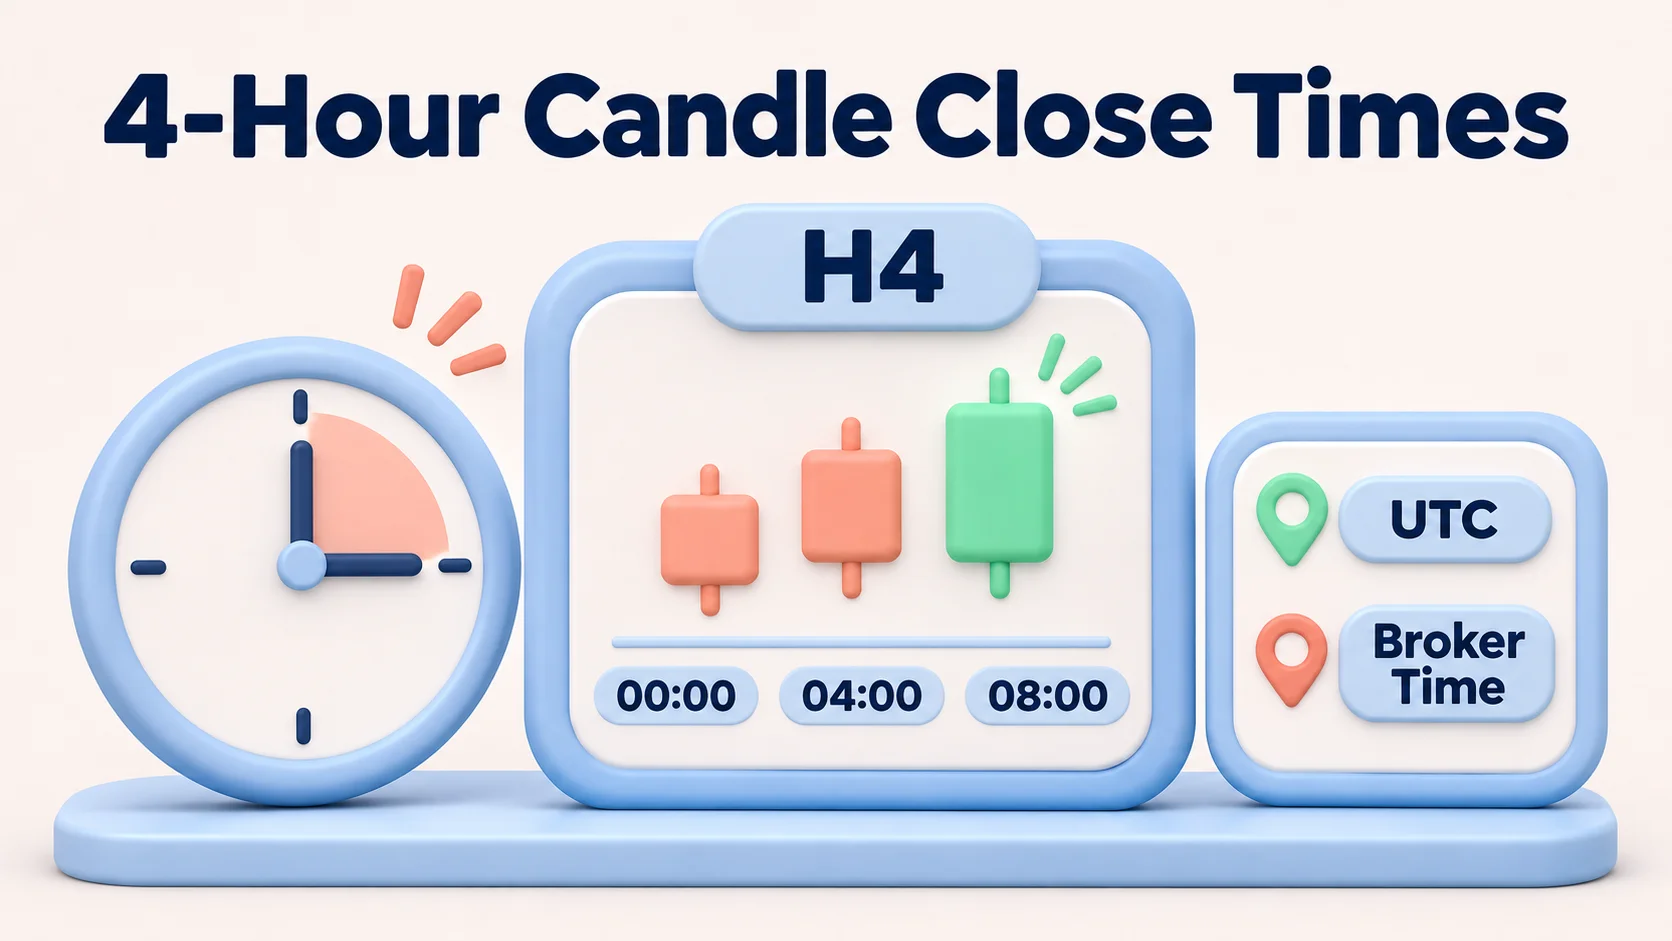
A four-hour (H4 or 4H) candle closes when its four-hour chart interval ends. On many MetaTrader forex charts, the boundaries are 00:00, 04:00, 08:00, 12:00, 16:00 and 20:00 in the broker's server time. On a chart deliberately aligned to the 5:00 p.m. New York forex day close, the corresponding H4 boundaries are 1:00, 5:00 and 9:00 a.m. and p.m. New York time.
These are different reference clocks, not conflicting answers—and they can sometimes describe the same candle boundaries. For example, midnight on a UTC+2 broker server in January coincides with 5:00 p.m. in New York on the previous day; a shift to UTC+3 alongside New York daylight time can preserve that alignment. Confirm the chart’s bar construction and server-time policy before converting a dated close to your local time.
H4 candle closing times at a glance
| Chart convention | Illustrative closing times | Clock you are reading | Main qualification |
|---|---|---|---|
| Broker-midnight-aligned H4 chart | 00:00, 04:00, 08:00, 12:00, 16:00, 20:00 | Broker/server time | Must verify the broker's server offset and any seasonal changes |
| UTC-midnight-aligned H4 chart | 00:00, 04:00, 08:00, 12:00, 16:00, 20:00 | UTC | A UTC schedule, not a rule for every forex provider |
| New York-close-aligned forex chart | 01:00, 05:00, 09:00, 13:00, 17:00, 21:00 | New York local time (ET) | Equivalent UTC hours change when New York enters or leaves daylight saving time |
These are boundaries for normal, complete H4 bars. Weekends, maintenance breaks and shorter instrument sessions can produce missing or shortened bars.
The difference is easiest to see on a common UTC clock:
What does it mean when a four-hour candle closes?
An H4 candlestick represents the prices observed over a chart-defined four-hour period. Its open is the first price in the period, the high and low are its extremes, and the close is the last price used by that bar. A live, unfinished candle can change its high, low and closing value until the interval ends.
A candle's timestamp generally identifies when it opened, not when it closed. For example, on a chart aligned to 00:00 server time, a completed bar labelled 08:00 spans the 08:00–12:00 interval and closes as the 12:00 bar begins. The next bar may not appear immediately if the market is not quoting at that boundary.
This is why traders distinguish an H4 wick through resistance from an H4 close above resistance. A candle that traded above a price level at 10:00 may finish below it at 12:00. That does not reveal what price will do next, but for a price action approach the difference can determine whether a rule requiring a completed close has been met.
Distinguish the candle’s displayed opening timestamp, its scheduled end and the first quote that confirms completion; they need not occur at the same instant.
Why H4 candle times differ between brokers and chart platforms
Four-hour candles are not synchronized by a central forex exchange. The same currency pair can be displayed by services that use different data feeds, chart sessions and time bases. The most common causes of apparent disagreement are:
- Server-day boundaries. MetaTrader chart timestamps ordinarily follow the broker's server time. If one server is aligned to UTC midnight and another is aligned to a different daily cutoff, the H4 intervals can contain different price movements.
- New York-close alignment. Some forex chart histories are arranged around the conventional 5:00 p.m. New York trading-day boundary. That is a convention used by certain providers, not a setting to assume from the platform name alone.
- Instrument sessions. TradingView constructs time-based intraday bars using the symbol's session and feed. On a market that opens at 09:30 and closes at 16:00, a four-hour chart may contain a final bar shorter than four hours.
- Seasonal clock changes. A broker may hold a constant UTC offset, follow European daylight-saving dates, follow US dates or use another policy. The apparent close hour in your country can change even while the displayed server hour remains the same.
- Market interruptions. Weekend closures, holidays and scheduled daily maintenance can delay a new bar or interrupt normal interval coverage.
Different bid-price feeds may also produce different candle shapes, even when their time boundaries match. A difference in a candle's close price should not be mistaken for a difference in its close time.
Illustrative comparison: two broker server clocks
Suppose two hypothetical brokers both align H4 bars to midnight in their own server time, but Broker A uses UTC+2 and Broker B uses UTC+0 on the date being compared. Their server-time boundaries translate into different UTC close times:
| Illustrative broker | Assumed server time | H4 boundaries expressed in UTC |
|---|---|---|
| Broker A | UTC+2 | 22:00 (previous day), 02:00, 06:00, 10:00, 14:00, 18:00 |
| Broker B | UTC+0 | 00:00, 04:00, 08:00, 12:00, 16:00, 20:00 |
These hypothetical offsets apply only on the date considered. Check your broker’s server-offset policy and trading hours, then verify the boundaries against completed bars on your account.
How to find the H4 candle closing time on MT4 or MT5
For MetaTrader, start with the actual account and server you intend to use, not an online list of generic “MT4 candle times.”
- Select your currency pair and the H4 timeframe. In MetaTrader 4, the H4 chart can be selected from the timeframe controls; FxRanking's MT4 guide explains the basic chart workflow. MT5 also provides H4 among its chart intervals.
- Read a completed candle's opening timestamp. Use the cursor or data window to inspect a historical H4 bar. On a straightforward midnight-aligned server, a bar labelled 08:00 normally ends at 12:00 server time.
- Identify the broker/server clock. Compare the chart and the Market Watch time with a reliable UTC clock while quotes are arriving. In MetaTrader, the last known server time comes from quote activity; a displayed time may stand still when the market is closed.
- Check the server’s UTC offset for the relevant date. Convert the completed bar’s end to UTC; do not assume the offset measured in January applies in July.
- Confirm the next H4 bar on the same symbol. Its opening timestamp is the practical confirmation that the preceding bar is complete. Around the start or end of the trading week, apply the broker's actual session hours rather than mechanically adding four hours.
MetaTrader server time is not your computer clock. Market Watch may still show Friday’s last quote time over a weekend because the displayed time updates with incoming quotes.
Worked MetaTrader conversion: 12:00 server time
Suppose an H4 bar opens at 08:00 broker time and is scheduled to close at 12:00. On January 15, 2026, a confirmed UTC+2 server gives 10:00 UTC or 15:30 India Standard Time (IST). If the same broker uses UTC+3 on July 15, its 12:00 close becomes 09:00 UTC or 14:30 IST. Verify the completed bar before applying a close-based rule.
Trading-rule example: Suppose a written rule requires an H4 close above 1.0850. A temporary wick to 1.0853 at 11:45 is not enough: if the completed 12:00 bar closes at 1.0848, that condition was not met. Even a close above the level does not guarantee an executable entry at that price.
How to check H4 closes on TradingView
On TradingView, select a four-hour interval (often labelled 4h) for the exact symbol and data provider. Hover over a completed candle to inspect its timestamp. Open the chart's timezone control—available from the bottom clock or chart settings—to display those timestamps in a useful timezone, such as UTC or New York.
Changing the displayed timezone relabels the time axis; it does not by itself rebuild the underlying candles. The symbol's exchange/session definition and data provider govern bar construction. A London-labelled chart and a New York-labelled chart can therefore show the same bars with different time-axis labels.
When comparing TradingView with MetaTrader, match the symbol, data source, session setting and actual UTC boundaries—not merely the displayed timezone.
For a close-based alert: On an H4 chart, choose an eligible indicator- or drawing-based condition and select Once Per Bar Close where available. This prevents a signal from firing on an unfinished candle, though some price-only alerts do not offer that frequency. Alerts can also arrive after the scheduled boundary if quotes are delayed.
H4 candle closes in UTC: winter and summer examples
A UTC-midnight schedule stays fixed in UTC; a New York-close schedule shifts one UTC hour as Eastern Time changes between EST (UTC−5) and EDT (UTC−4).
| Chart alignment | UTC close times on January 15, 2026 | UTC close times on July 15, 2026 |
|---|---|---|
| UTC-midnight-aligned H4 | 00:00, 04:00, 08:00, 12:00, 16:00, 20:00 | 00:00, 04:00, 08:00, 12:00, 16:00, 20:00 |
| 5:00 p.m. New York-close-aligned H4 | 02:00, 06:00, 10:00, 14:00, 18:00, 22:00 | 01:00, 05:00, 09:00, 13:00, 17:00, 21:00 |
The times are listed within each UTC calendar day. The New York-close boundaries remain 01:00, 05:00, 09:00, 13:00, 17:00 and 21:00 in New York local time in both seasons.
What time do H4 candles close in India, Pakistan, Malaysia, Indonesia, South Africa and the UK?
Local H4 close times depend on the chart’s alignment. The table converts the six boundaries of a hypothetical New York-close-aligned H4 chart—01:00, 05:00, 09:00, 13:00, 17:00 and 21:00 New York time—on two dates in 2026.
| Location and time zone | January 15, 2026 (New York: EST, UTC−5) | July 15, 2026 (New York: EDT, UTC−4) |
|---|---|---|
| New York, US — ET | 01:00, 05:00, 09:00, 13:00, 17:00, 21:00 | 01:00, 05:00, 09:00, 13:00, 17:00, 21:00 |
| London, UK — GMT / BST | 06:00, 10:00, 14:00, 18:00, 22:00, 02:00 (+1 day) | 06:00, 10:00, 14:00, 18:00, 22:00, 02:00 (+1 day) |
| India — IST (UTC+5:30) | 11:30, 15:30, 19:30, 23:30, 03:30 (+1 day), 07:30 (+1 day) | 10:30, 14:30, 18:30, 22:30, 02:30 (+1 day), 06:30 (+1 day) |
| Pakistan — PKT (UTC+5) | 11:00, 15:00, 19:00, 23:00, 03:00 (+1 day), 07:00 (+1 day) | 10:00, 14:00, 18:00, 22:00, 02:00 (+1 day), 06:00 (+1 day) |
| Malaysia — MYT (UTC+8) | 14:00, 18:00, 22:00, 02:00 (+1 day), 06:00 (+1 day), 10:00 (+1 day) | 13:00, 17:00, 21:00, 01:00 (+1 day), 05:00 (+1 day), 09:00 (+1 day) |
| Indonesia — Jakarta/WIB (UTC+7) | 13:00, 17:00, 21:00, 01:00 (+1 day), 05:00 (+1 day), 09:00 (+1 day) | 12:00, 16:00, 20:00, 00:00 (+1 day), 04:00 (+1 day), 08:00 (+1 day) |
| South Africa — SAST (UTC+2) | 08:00, 12:00, 16:00, 20:00, 00:00 (+1 day), 04:00 (+1 day) | 07:00, 11:00, 15:00, 19:00, 23:00, 03:00 (+1 day) |
How to read the table: Each row follows those six boundaries in order; (+1 day) means the next local calendar day.
Indonesia has three time zones. This row uses Jakarta (WIB, UTC+7), not Makassar (WITA, UTC+8) or Papua (WIT, UTC+9).
The London times match in January and July because the city is five hours ahead of New York on both dates. During the DST mismatch periods below, that difference is four hours.
What happens during daylight-saving changes?
In 2026, US daylight saving time runs from March 8 to November 1, while UK clocks change on March 29 and October 25. London is only four hours ahead of New York during March 8–28 and October 25–31, rather than the usual five.
For dated conversions, prefer regional timezone names such as America/New_York, Europe/London and Asia/Kolkata over fixed labels such as “EST” when daylight-saving rules apply.
When does the next four-hour candle close?
The next H4 close depends on the current dated time, your chart’s bar boundaries and the symbol’s trading hours.
- Identify the last completed candle on the exact H4 chart and the current interval’s next boundary.
- During a continuous session, move to the next four-hour boundary in the chart’s time basis. During a closure, use the symbol’s actual trading schedule instead of counting nonexistent weekend bars.
- Convert that dated boundary to your local timezone and wait for a valid new quote or bar before treating a close-based condition as final.
Example: At 10:30 UTC in a normal trading session, the next UTC-midnight-aligned H4 boundary is 12:00 UTC. A New York-close-aligned chart in January instead closes next at 14:00 UTC. These are examples, not a live countdown.
Can the candle close while the forex market is closed?
A theoretical four-hour boundary may pass without a new tradable candle during weekends, maintenance or holidays. Check your broker’s actual instrument hours.
Confirm whether your broker can accept forex orders; a chart clock alone cannot. Crypto and exchange-listed instruments follow different sessions and are not reliable templates for forex H4 closes.
Candle close versus New York rollover
Many retail forex schedules use 5:00 p.m. New York time as a financing or trading-day boundary, sometimes accompanied by wider spreads or an execution break. Rollover is not a buy or sell signal, and the boundary need not coincide with an H4 close on every chart.
If a strategy enters immediately after an H4 close, look at the actual bid-ask spread rather than the displayed candle alone. The forex spreads explainer shows why quoted entry and exit prices can differ from a chart's indicative mid or bid price. Scheduled events on the forex economic calendar can also coincide with a close and affect execution.
Common mistakes when reading four-hour candle times
- Using computer time as MetaTrader server time. The broker’s chart clock may use a different timezone.
- Reading a bar’s label as its close. An 08:00 H4 timestamp normally marks the opening, not the 12:00 close.
- Calling every New York time “EST.” New York uses EST (UTC−5) in winter and EDT (UTC−4) in summer; its DST-change dates also differ from London’s.
- Assuming TradingView’s timezone setting redraws candles. It generally relabels the time axis, not the symbol’s session alignment.
- Copying schedules from another market. Crypto, stock and gold CFD sessions may differ from retail spot forex.
- Acting before the candle is finished. A close-dependent signal cannot be confirmed while the bar is forming.
- Equating a candle close with executable pricing. Order availability, spreads and fresh quotes are separate from chart timing.
For reproducible records, save the candle’s opening and closing times in UTC, its broker offset, symbol and date alongside the chart. FxRanking’s forex trading journal can help.
A reliable H4 close-time checklist
Before relying on a specific four-hour close, verify the following:
| Check | What to record |
|---|---|
| Instrument | Exact symbol, market type and data provider |
| Platform | MT4, MT5, TradingView or another chart service |
| Bar alignment | Broker-midnight, UTC, New York-close or exchange/session-defined |
| Time basis | Chart/server timezone and the current offset to UTC |
| Trading date | Date in the source timezone and whether daylight saving applies |
| Bar status | Completed historical H4 candle, not the forming rightmost candle |
| Session status | Weekend, maintenance, holiday or early-close exception |
| Execution conditions | Actual spread and account order availability if a trade is intended |
The goal is a reproducible timestamp backed by enough chart and session details to check later.
Key takeaways
- Many MetaTrader H4 charts are organized into 00:00, 04:00, 08:00, 12:00, 16:00 and 20:00 server-time boundaries, but the server's relationship to UTC must be checked.
- A New York-close-aligned chart has H4 boundaries at 01:00, 05:00, 09:00, 13:00, 17:00 and 21:00 New York time. Their UTC equivalents shift with US daylight saving.
- TradingView's displayed timezone is not the same as the symbol's session anchoring. A changed axis clock does not necessarily change the bar construction.
- Country-specific closing times require the chart’s alignment and the date, not just the trader’s location.
- A completed H4 candle is useful for applying a written trading rule, but its close is not a forecast and does not guarantee favorable execution.
Verify your chart’s H4 boundaries first, convert the dated close to local time and check real execution conditions before acting.
FAQs
What time do four-hour forex candles close?
There is no universal local close time. Many broker-midnight-aligned MetaTrader charts end H4 bars at 00:00, 04:00, 08:00, 12:00, 16:00 and 20:00 server time. Check your broker’s server offset and trading sessions before converting those hours.
When does the H4 candle close in New York time?
On a forex chart specifically aligned to the 5:00 p.m. New York day close, normal H4 boundaries are 01:00, 05:00, 09:00, 13:00, 17:00 and 21:00 New York local time. Other chart alignments can differ.
What time do 4-hour candles close in GMT or UTC?
On a UTC-midnight-aligned chart, the boundaries are 00:00, 04:00, 08:00, 12:00, 16:00 and 20:00 UTC. A New York-close-aligned chart has 02:00, 06:00, 10:00, 14:00, 18:00 and 22:00 UTC in January, but 01:00, 05:00, 09:00, 13:00, 17:00 and 21:00 UTC in July. UK summer time (BST) is not GMT.
What time does an H4 candle close in India?
The time depends on the chart convention. For example, on January 15, 2026, a 09:00 New York-time H4 close converts to 19:30 India Standard Time. The same 09:00 New York-time boundary is 18:30 IST on July 15, 2026. These are examples, not a universal India H4 schedule.
What time does the H4 candle close in Malaysia or Pakistan?
You need the broker or chart’s UTC boundary first. For a New York-close-aligned bar ending at 09:00 New York time, the example close is 22:00 in Malaysia and 19:00 in Pakistan on January 15, 2026; on July 15 it is 21:00 in Malaysia and 18:00 in Pakistan.
Do H4 candles close at the same time on MT4, MT5 and TradingView?
Not necessarily. MT4 and MT5 chart timestamps generally follow their broker’s server time, while TradingView bar construction depends on the symbol and its trading session. Match the actual underlying bar times in UTC, not only the timezone shown on the screen.
Does changing TradingView’s chart timezone change candle closes?
Changing the displayed chart timezone generally relabels the time axis and clock; it does not by itself rebuild the symbol’s candles or change its session boundaries. Use the exact symbol and feed when comparing charts.
When does the next 4-hour candle close?
Find the current H4 interval on your actual chart, identify its next valid time boundary, check whether the symbol is trading and convert that dated instant to your local timezone. A static close-times table cannot reliably provide a live next-close answer across all brokers.
How many H4 candles are in a day?
A complete 24-hour period contains six four-hour intervals. A chart may display fewer, missing or shortened candles when the instrument has an exchange session, weekend closure, maintenance break or holiday exception.
Why do H4 candle close times change with daylight saving?
A fixed local clock time can represent a different UTC instant after a timezone changes its offset. New York changes between EST and EDT, while broker servers may follow different seasonal rules. Date-aware timezone conversion avoids many one-hour errors.
Is a four-hour candle close a reason to buy or sell forex?
No. The close tells you that a chart interval is complete. It can be part of a clearly defined trading rule, but it does not forecast price direction, guarantee continuation or ensure that an order will fill at the expected price.

Stephen Bennet
Stephen Bennet is a Forex reviewer and financial analyst with more than 25 years of experience in the financial markets. He specializes in reviewing brokers, evaluating trading platforms, and explaining the Forex market in a clear and practical way. Through independent, trader-focused analysis, Stephen helps readers compare providers, understand key risks, and choose platforms with greater confidence.