A move above resistance or below support can look like the start of a strong trend, but not every breakout continues. A 4-hour candle breakout strategy makes the decision more systematic by checking whether a completed H4 candle closes beyond a price range marked before the break. The trader then considers the entry, the point of invalidation and the room available for a worthwhile target rather than assuming the move will continue.
This approach uses an eight-candle range and H4 retest, a pre-breakout volatility buffer and a hypothetical EUR/USD example with explicit calculations. The rules are educational hypotheses, not a validated profitable system or a recommendation to trade.
What counts as a breakout on the four-hour chart?
A bullish breakout occurs when price moves above an established resistance boundary; a bearish breakout moves beneath support. A wick through the level is not the same as a closing-price break. If an H4 candle trades above resistance but ends inside the earlier range, a close-based strategy has not triggered, even if a lower timeframe briefly looked strong.
A completed close removes one source of ambiguity—the signal cannot disappear before the bar ends—but it does not prove that buyers or sellers will continue in the same direction. A four-hour candle may close outside the range and the very next candle may move back inside. In forex breakout trading, a completed close is only one condition; the plan also needs to say when a break has failed.
The distinction is easiest to see when the boundary is fixed in advance. Suppose resistance is 1.0900. A candle that reaches 1.0909 but closes at 1.0898 has pierced that resistance without closing above it. A different H4 candle closing at 1.0912 has met a simple close-above-resistance condition, although the stronger buffered rule below must still be checked.
A candle’s real body shows its open-to-close move, while its wicks show the extremes. Neither reveals the full path of prices within the four hours. This breakout strategy uses a measured range boundary, rather than the name of a candle formation; see other candlestick patterns for a broader discussion of candle shapes.
The H4 breakout-and-retest rules at a glance
Quick definitions: H4 means a four-hour candle; ATR (average true range) measures recent price movement; a pip is 0.0001 in EUR/USD; a retest is a return toward the broken range boundary; and 1R is the planned entry-to-stop risk before separately charged costs. The bid is the price at which a trader typically sells, and the ask the price at which a trader typically buys.
| Element | Illustrative rule | Purpose |
|---|---|---|
| Chart | EUR/USD, H4; one consistent broker price feed | Keep four-hour candle boundaries consistent |
| Reference range | Highest high and lowest low of the eight H4 candles completed before the breakout candidate | Avoid drawing the range after seeing the break |
| Volatility measure | ATR(14) calculated from completed H4 candles at the end of that eight-candle range | Fix the buffer before the signal |
| Breakout | H4 close above range high + 0.20 × ATR for a long; below range low − 0.20 × ATR for a short | Reject marginal closes |
| Retest window | The next three completed H4 candles | Put a time limit on waiting |
| Retest confirmation | The first qualifying retest must touch the band and close back on the breakout side; no second attempt is allowed for that breakout if the entry checks fail | Test whether the broken level holds |
| Entry | Next available executable quote after the qualifying retest candle closes (ask for a typical long; bid for a typical short) | Do not assume a fill at a historical closing price |
| Stop | Below the retest bid low for a long, or above the retest ask high for a short, by 0.10 × ATR; round the buffer up to a whole pip in this EUR/USD example | Define where the setup fails |
| Target and minimum room | Range-height projection, with at least 1.5R on executable quote-side prices before separately charged costs, and no preidentified direction-specific opposing level before the target (defined, with a fixed lookback, in Step 6) | Avoid forcing a trade with limited upside or downside |
| Time exit | Exit at the next executable quote after the 12th H4 close following the entry fill if neither stop nor target has executed; count the first close after the fill | Make unresolved trades testable |
These settings make the model reproducible, not proven profitable. The eight-candle window establishes a rolling reference range; the ATR breakout buffer filters marginal closes; and the ATR retest band and three-candle window define how close, and how soon, price must return. The ATR stop buffer sets the retest-based invalidation distance, the 1.5R condition specifies minimum projected reward relative to price risk, and the twelve-candle time exit limits unresolved trades. These values are illustrative rather than empirically established optima. Keep them, along with the opposing-level lookback defined in Step 6, fixed for an initial test; assess alternatives on separate data to avoid overfitting.
How to trade the H4 range breakout, step by step
1. Use the same four-hour chart and price basis throughout
Choose an instrument and data source before studying setups. Record whether candles are built from broker server time, UTC or another clock. H4 bars formed on different schedules may have different highs, lows and closing prices, so the same strategy can create different signals on two platforms.
On MetaTrader 4, select H4 using the chart timeframe controls and confirm which price feed the bars use. For the baseline rules and EUR/USD illustrations here, use one broker's H4 bid OHLC series consistently for range, ATR, breakout and retest calculations. In a typical OTC forex account, a long opens at the ask and closes at the bid; a short opens at the bid and closes at the ask. Broker-specific stop and limit trigger conventions can differ, so verify the account's rules and model the relevant quote side in testing. Do not count the spread twice: either model executable bid/ask prices directly or apply spread explicitly to a single-price data series.
2. Freeze a range using the previous eight completed H4 candles
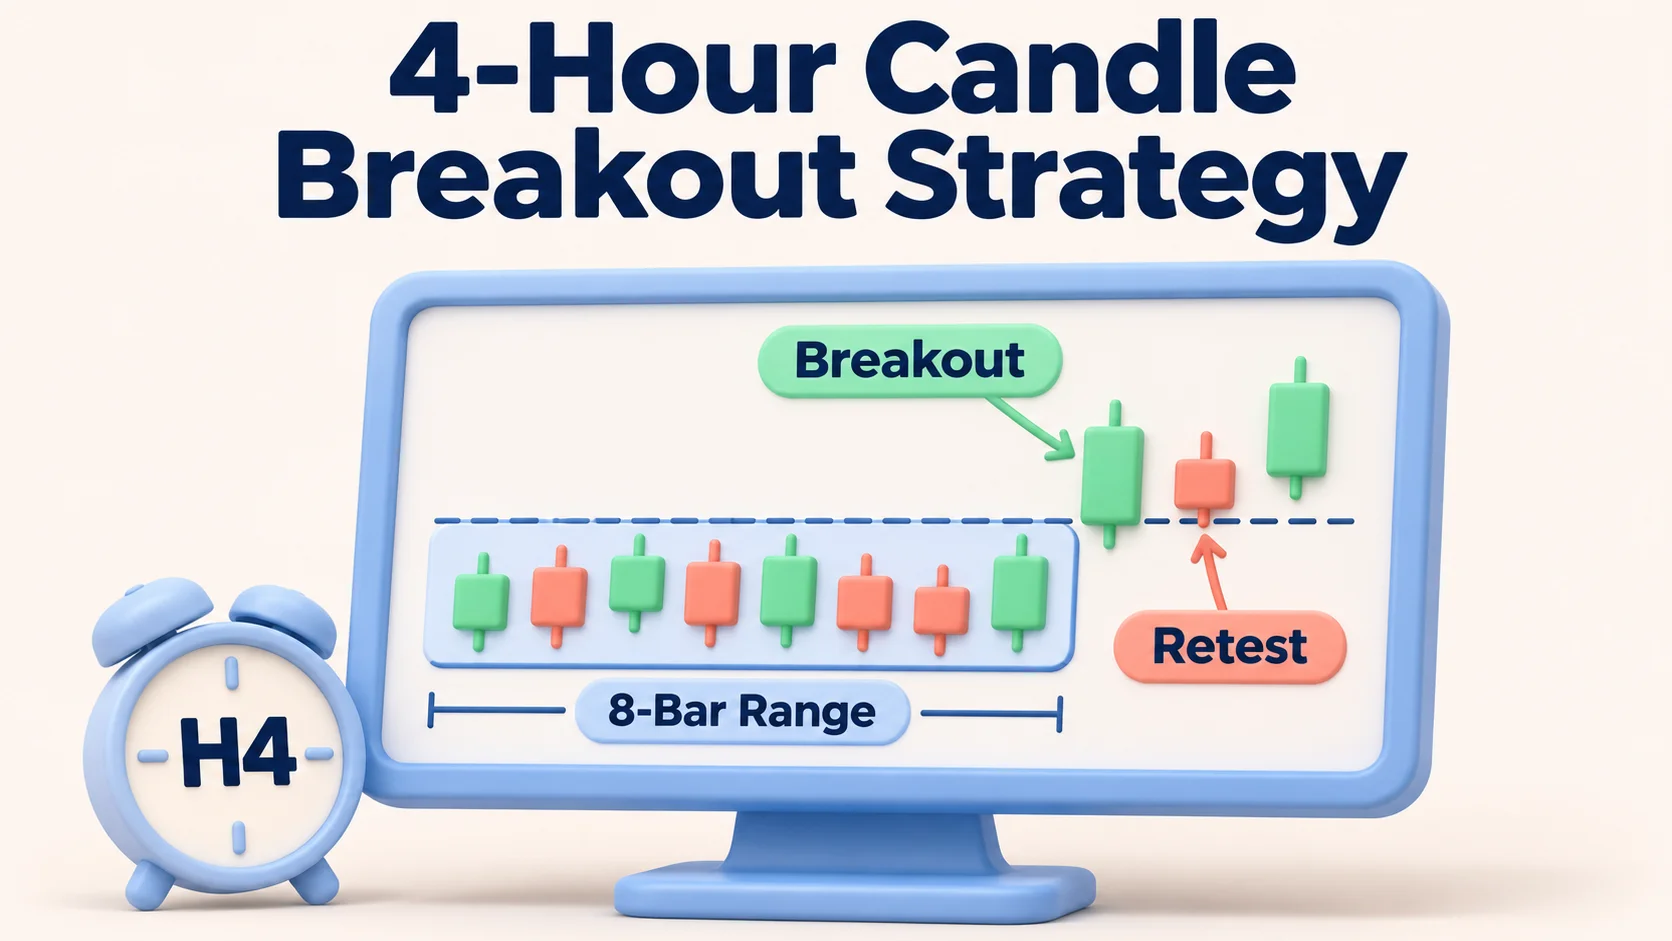
At the close of an H4 candle, inspect the eight candles that have just completed. Mark their highest high as the range high (R-high) and their lowest low as the range low (R-low). The next candle—not one of those eight—is the first potential breakout candle.
For example, if those eight candles span 1.0850 to 1.0900, the measured range is 50 pips because (1.0900 − 1.0850) ÷ 0.0001 = 50. Keep the candidate breakout candle outside this calculation; otherwise its new extreme changes the level it is meant to break.
How the range rolls forward: When no setup is active, each newly completed H4 candle is assessed as the next breakout candidate against the eight completed candles immediately before it. If it does not meet the breakout rule, the next candidate uses a rolling window: drop the oldest candle and include the failed candidate in the new eight-candle range. Once a breakout qualifies, freeze that range and its ATR for the full three-candle retest window. If the setup is invalidated, expires or fails entry checks after its first qualifying retest, resume scanning with the next completed H4 candle. The baseline model allows only one active setup or open trade per instrument; overlapping setups or positions should be treated as a separate strategy and tested separately.
An eight-candle range does not necessarily mean sideways consolidation. The highest-high/lowest-low box is a rolling price channel: its candles may be sideways, trending or volatile. A narrow, repeatedly tested box and a wide, turbulent box may behave differently. Record range height, the number of touches and recent volatility during testing. Any additional consolidation-quality filter would change the model and needs its own test.
3. Require a buffered H4 close beyond the range
Calculate the standard Wilder ATR(14) from completed candles on the same H4 bid OHLC feed. For each candle, true range is the greatest of: high minus low; the absolute difference between high and the previous close; or the absolute difference between low and the previous close.
Seed ATR with the arithmetic mean of the first 14 true-range observations. For each later candle, use ((previous ATR × 13) + current true range) ÷ 14. Indicator initialization can vary slightly between platforms. Use one consistent implementation and enough historical data for the ATR to stabilize.
Freeze ATR at the close of the final candle in the eight-bar reference range, before the breakout candidate. Use it for the breakout threshold, retest band and stop buffer. Do not recalculate it during the active setup. ATR summarizes recent movement; it does not predict direction or set a maximum loss. For this model, the breakout buffer is 20% of the frozen ATR value.
- Long: The candidate H4 candle must close strictly above R-high + 0.20 × ATR.
- Short: It must close strictly below R-low − 0.20 × ATR.
If ATR is 25 pips and R-high is 1.0900, the buffer is 5 pips. The long threshold is 1.0905, so a close at 1.0903 fails, while a close at 1.0912 passes. A close exactly on the threshold also fails.
A buffer filters small breaks, but can also delay entry and reduce the available distance to the projected target.
4. Wait for a shallow retest within three H4 candles
A qualifying long retest must occur in one of the next three completed H4 candles after the breakout close. Using the frozen ATR, its low must fall within the band from R-high − 0.20 × ATR to R-high + 0.20 × ATR, inclusive. The candle must close above R-high.
Before a qualifying retest, any candle that closes at or below R-high invalidates the setup. A candle that trades below the band's lower edge during the retest window also invalidates it, even if it later recovers and closes above R-high.
For a short, reverse the logic using the same frozen ATR: the high must touch the band from R-low − 0.20 × ATR to R-low + 0.20 × ATR, the candle must close below R-low, and a close at or above R-low ends the setup. Any candle in the window that trades above the band's upper edge invalidates the setup, even if it later recovers and closes below R-low.
What qualifies as a touch? The H4 low (for a long) or H4 high (for a short) must be inside the stated band; an entire candle that stays well beyond the broken boundary is not a retest. If the window expires without a qualifying candle, record no trade. Do not extend the window because the chart later happens to offer a good entry.
The first qualifying retest is the only entry opportunity: After the first H4 candle that satisfies the retest-price and close conditions, evaluate the stop, reward-to-risk, opposing levels and executable entry. If any entry check fails, record no trade and close that setup; do not wait for a second retest of the same breakout even if part of the three-candle window remains. Resume the rolling scan with the next completed H4 candle. This is a fixed convention for the illustrative model, not a validated performance advantage.
A retest adds an observable entry condition; it does not prove that former resistance has become support or vice versa.
5. Enter after the retest closes and define invalidation
For a long, use the next available executable ask quote after the retest closes; for a short, use the next available executable bid quote. Place a long stop below the retest candle’s bid low by 0.10 × the frozen ATR, or a short stop above its ask high by the same buffer. Round the EUR/USD buffer up to a whole pip. If historical ask prices are unavailable, document any spread estimate used for the short stop. Recalculate reward-to-risk from the executable entry and exit-side prices. Skip if the entry is at or beyond the planned stop, the projected ratio falls below 1.5R, or broker stop-distance and lot-size restrictions cannot be met.
The stop is based on the retest candle’s extreme, rather than necessarily requiring price to cross back through the original range boundary. For a shallow bullish retest, it can remain above the former resistance; for a shallow bearish retest, it can remain below the former support. Reaching the stop therefore invalidates this retest-based entry, but does not necessarily mean the whole breakout has failed. An ordinary stop-loss order triggers an exit instruction, but a fast market can fill it beyond the chosen level.
6. Check the projected target against the actual risk
The range-height projection offers a transparent starting target:
- Long target = R-high + (R-high − R-low).
- Short target = R-low − (R-high − R-low).
The range-height projection does not predict how far price will move. In this model, the long target is a bid-side exit level and the short target an ask-side exit level, although both start from the bid-chart range. Measure the distance from the actual executable entry quote to the relevant stop and target. The projected reward must be at least 1.5R on those quote-side prices, where 1R is the planned stop distance. This is a gross price-based entry filter: the spread is already reflected in bid/ask fills, but separately charged commissions, financing and additional slippage are not included in the threshold. Account for those costs when evaluating net results. Also reject a trade if a preidentified opposing level lies between entry and target.
Define opposing levels before the breakout: At the close of the final candle in the eight-bar reference range, record the high and low of the most recently completed broker-defined daily candle and confirmed H4 swing levels whose pivot candles fall within the 48 completed H4 candles ending with that reference-range candle. For a long, only the daily high and confirmed H4 swing highs count as potential resistance; for a short, only the daily low and confirmed H4 swing lows count as potential support. A confirmed H4 swing high is strictly higher than the highs of the two H4 candles before and two after it; a confirmed swing low is strictly lower than their lows. Include a swing only if both right-hand confirmation candles had closed by the reference-range close. Freeze the eligible levels before the breakout candidate begins. Skip a long if eligible resistance lies above the executable entry but at or below the projected target; skip a short if eligible support lies below entry but at or above target. The 48-candle lookback is an illustrative testing choice, not a proven optimum.
Do not move the target to manufacture a passing reward-to-risk ratio. If the fixed projection leaves less than 1.5R, record no trade.
7. Keep the exits fixed, including an unresolved-trade exit
Once entered, the model uses the initial stop and target. Count twelve H4 candle closes after the entry fill: the first H4 candle to close after the fill counts, even if the position opened partway through that candle. If neither stop nor target has executed by the twelfth close, exit at the next available executable quote and record the actual result. A time exit is important because a range breakout can stall without reaching either level.
A four-hour signal can remain open over several sessions and potentially a weekend. Margin, financing, spread changes and reopening gaps can affect the result. Because forex session hours describe market activity rather than guaranteed broker access, check when your actual account accepts and executes orders.
Worked example: a hypothetical EUR/USD H4 breakout
Assume an H4 bid chart shows eight completed EUR/USD candles contained between 1.0850 and 1.0900. Wilder ATR(14), measured at the close of the final range candle, is 25 pips. These are invented prices used to demonstrate the rules; the chart is not historical performance evidence. For the long execution arithmetic below, treat 1.0909 as the assumed ask entry and 1.0892 stop and 1.0950 target as bid-side exit levels. The one-pip difference between the retest close of 1.0908 and the assumed 1.0909 ask is illustrative only; actual spreads and next quotes vary.
| Stage | Price or calculation | Result |
|---|---|---|
| Range high / low | 1.0900 / 1.0850 | 50-pip range |
| Breakout buffer | 0.20 × 25 pips | 5 pips |
| Long breakout threshold | 1.0900 + 0.0005 | Close must exceed 1.0905 |
| Completed breakout close | 1.0912 | Passes the buffer |
| Permitted retest-low band | 1.0895 to 1.0905 | Fixed for the three-candle window |
| Retest candle | Low 1.0895, close 1.0908 | Touches the band and closes above 1.0900 |
| Next executable long entry (assumed ask) | 1.0909 | After the retest close |
| Stop buffer | 0.10 × 25 = 2.5 pips, rounded up | 3 pips |
| Stop (bid-side exit level) | 1.0895 − 0.0003 | 1.0892 |
| Projected target (bid-side exit level) | 1.0900 + (1.0900 − 1.0850) | 1.0950 |
| Stop / target distance from entry | 17 pips / 41 pips (ask entry to bid exits) | 2.41R on assumed executable quotes, before separately charged costs |
The 1.0895 retest low and close above 1.0900 meet the retest-price conditions; all entry checks are made only after that H4 candle is complete.
Convert the stop distance into position size
Suppose the account contains $12,000 USD and the illustration allows 0.5% ($60) of equity as the planned price-movement risk budget. On EUR/USD, a standard lot of 100,000 EUR is worth approximately $10 per pip when P&L is denominated in USD.
Theoretical position in standard lots = $60 ÷ (17 pips × $10 per pip per lot) = 0.35294 lots.
If the broker accepts 0.01-lot increments, round down to 0.35 lots. That is 35,000 EUR of base exposure and $3.50 per pip. At the assumed stop fill, the 17-pip ask-entry-to-bid-exit move implies a $59.50 price loss. A 41-pip rise to the projected bid-side target implies a $143.50 gross price gain. Both figures are before any separately charged commissions, financing or additional slippage. If the assumed entry price already incorporates the spread, do not deduct that spread a second time.
The $60 price-movement risk budget excludes separately charged commissions. Reduce position size if the 0.5% limit must cover those fees; gaps and slippage can still increase realized loss.
The 0.5% input is illustrative, not a universally safe percentage. The FxRanking forex position size calculator can help recalculate size for a different pair, account currency, commission or broker increment.
One reason to reject this example: Suppose a preidentified previous-day high or confirmed H4 swing high stands at 1.0920. From a 1.0909 entry, only 11 pips remain to that obstacle, versus 17 pips to the stop. The nominal 1.0950 range projection no longer represents unobstructed target room. Skip the trade rather than assuming price will pass through the level.
Bearish H4 breakout: the same model in reverse
Imagine eight completed H4 candles between 1.2600 (R-low) and 1.2670 (R-high), with a frozen ATR of 30 pips. The short breakout buffer is 6 pips, so a qualifying bearish candle must close below 1.2594. A close at 1.2591 passes; a wick below 1.2594 followed by a close at 1.2605 does not.
In one of the following three H4 candles, a permitted retest high must fall within 1.2594 to 1.2606, and the candle must close below 1.2600. A retest high at 1.2603 followed by a close at 1.2597 meets these conditions if no intervening close reached or exceeded 1.2600. The short stop goes above the corresponding ask-side retest high by the fixed ATR buffer, rounded up to a whole pip. The downside range-height projection is 1.2530 (1.2600 − 0.0070).
The 1.2530 projection from bid-chart prices is an ask-side take-profit level: the bid may need to fall below 1.2530 before the short closes. Calculate the ratio from the executable bid entry and ask-side exits, subject to broker trigger rules.
Short-side execution example: Assume the retest high of 1.2603 is on the bid chart and the corresponding ask high is 1.2604, using an illustrative one-pip spread at that point. The 0.10 × 30-pip ATR stop buffer is 3 pips, making the ask-side stop 1.2607. If the next executable short entry is a bid quote of 1.2596, the planned stop distance is 11 pips and the projected gain to the 1.2530 ask-side target is 66 pips, or 6.00R before separately charged costs. Assuming the same $12,000 account and $60 price-risk budget as the long example, a $10-per-pip standard lot and 0.01-lot increments give 0.54 lots when rounded down: a $59.40 planned price loss or $356.40 projected gross price gain.
If the account charges an illustrative $7 round-trip commission per standard lot, the 0.54-lot position incurs $3.78 commission. Its planned $59.40 price loss would become a $63.18 net stop loss, exceeding a $60 commission-inclusive loss budget; the projected target gain would be $352.62 net under the assumed fills. If $60 must cover commissions, reduce the position to 0.51 lots: (11 × $10 + $7) × 0.51 = $59.67 at the stop. The corresponding 66-pip target would yield $336.60 before commission, or $333.03 net, giving approximately 5.58:1 net reward-to-risk. All results exclude any further slippage or financing and do not establish a likely outcome; opposing levels or execution conditions may still rule out the trade.
Seven possible outcomes of an H4 breakout attempt
Not every breakout attempt ends in an executed trade, and not every valid trade reaches its stop or target. Keeping these outcomes separate makes a trading record more informative.
| What the H4 chart shows | Decision under this model | Why |
|---|---|---|
| Wick reaches 1.0909, but candle closes 1.0898 against a 1.0900 range high | No breakout | No close beyond the boundary or buffer |
| Candle closes 1.0903 with a required threshold of 1.0905 | No breakout | Closes beyond resistance, but not beyond the predefined buffer |
| Candle closes 1.0912, then next H4 candle closes 1.0897 | Breakout invalidated | Price closes back inside the old range before a qualifying retest |
| Valid breakout occurs, but none of the next three H4 candles touches the retest band | Missed by design | Entry rule requires a retest within the fixed window |
| Valid entry is placed, then price reaches the stop before the target | Losing trade | A valid setup is not a guarantee of follow-through |
| Valid entry executes, and the target is reached before the stop | Winning trade | The target executes; one win does not establish a strategy advantage |
| Neither stop nor target executes before the twelve-candle time limit | Time exit | Close at the next executable quote; the result may be a gain or loss |
At the illustrative 0.35-lot long entry, a fill at the 1.0892 stop produces a $59.50 price loss (about −1R before separate costs); a worse fill loses more. This is a losing trade, not an invalid signal. An expired three-candle retest window instead produces no trade. Track rejected candidates alongside executed trades to measure each filter’s effect.
Would entering on the breakout candle close work better?
An immediate close-based entry can participate in moves that never retest the range, but may leave a larger distance to a suitable stop. Retest entries miss some continuing breakouts while offering a more specific invalidation level. Neither entry style has a universal edge; test them separately rather than selecting whichever looks better on a past chart.
Trading costs, news and broker conditions can override a clean chart
Fast markets can cause chart prices and executable quotes to diverge. Before acting, check the actual spread, commission, lot-size constraints, financing and order-execution limits.
Major economic releases can make an H4 close appear convincing and still produce a rapid reversal or an unexpectedly poor fill. The forex economic calendar helps identify relevant announcements; an event filter such as “avoid entries in the hour before a high-impact release” should be defined and evaluated separately rather than improvised after a loss.
Retail over-the-counter forex differs from exchange-traded currency futures. In many OTC arrangements, the provider is the customer’s counterparty and sets platform prices and execution conditions. Dealer models, leverage limits, margin requirements and customer protections vary by jurisdiction and provider. Check the relevant regulator’s register and the account agreement before funding; available margin does not determine whether a planned loss is affordable. A practical forex risk-management framework also accounts for correlated positions and forced liquidation.
Assess portfolio-level exposure, not just each trade: positions involving the same currency can move together. Set account-level exposure and drawdown limits in advance, specify the response if either is reached, and check free margin under adverse-move scenarios.
How to backtest the 4-hour candle breakout method fairly
The practical challenge is to recreate what a trader could have known when each decision was made. This matters even more for a breakout-and-retest model than for a strategy using only completed daily closes.
- Fix the market, price side and candle grid. Use one pair and a consistent H4 data source. Record whether OHLC is bid, ask or midpoint, the broker timezone and daylight-saving changes, the daily-candle boundary, and any missing or shortened trading periods.
- Freeze the eight-candle reference range and ATR. Calculate highs and lows only from the eight completed bars before each candidate. Use the chronological Wilder ATR(14) method described in Step 3, with adequate warm-up history. Store both boundaries and the ATR at the final range candle for every candidate. At that same timestamp, record the prior completed daily high/low and eligible confirmed H4 swing levels using the fixed 48-candle lookback.
- Process the rolling scan in order. When a candidate fails, roll the reference window forward by one completed candle. When a candidate qualifies, freeze its range, ATR and opposing levels for the three-candle retest window. Evaluate the first qualifying retest only; if its entry checks fail, record no trade rather than waiting for a second attempt. Apply the one-active-setup-or-trade rule and resume scanning only after invalidation, expiry, failed entry checks or closure of the trade. Do not use future bars to redefine an earlier range or signal.
- Record every outcome. Include wick-only breaks, close-inside failures, no-retest cases, qualifying entries, stop-outs, targets and twelve-candle time exits.
- Model executable prices. For a typical OTC account, model long entries at ask and exits at bid, and short entries at bid and exits at ask, subject to the broker's actual trigger rules. For shorts, evaluate stop and target triggers against historical ask quotes. Calculate the stop from the retest candle's ask high, not its bid high. If ask history is unavailable, document the spread assumptions used to estimate ask prices. Use variable bid/ask quotes where available; if using a single-price series, apply a realistic spread explicitly rather than adding it again to bid/ask data. Include commissions, swaps, broker lot increments, delayed fills, gaps and slippage not already reflected in the fills. Use the next available quote after the retest closes; do not assume a fill at the historical candle close. If the executable entry no longer meets the minimum reward-to-risk rule, record no trade.
- Handle same-candle ambiguity. If the relevant bid/ask prices touch both the stop and target within the same H4 bar, H4 OHLC data alone cannot tell which happened first. Use suitable lower-timeframe or tick data, or apply a predefined conservative rule rather than assuming the winning exit occurred.
- Keep a separate validation period. Test changes to range length, ATR buffers, retest window, opposing swing-level lookback or first-retest entry convention outside the untouched sample first. A strong-looking result after repeated tuning can be overfit.
- Measure net results and risk. Report trade count, skipped signals, average winning and losing R, net expectancy, maximum drawdown, profit factor, sensitivity to costs and results across different market regimes. Do not infer reliability from win rate alone.
Measure the strategy’s expectancy by averaging the net R result of every completed trade, including stop-outs, targets and twelve-candle time exits. Equivalently, expectancy is (proportion of all trades that win × average winning R) − (proportion of all trades that lose × average losing R), taking average losing R as a positive magnitude; flat trades contribute zero. Use executable bid/ask prices and deduct only costs not already included in those fills, never counting spread twice. If every winner gains 1.5R and every loser loses 1R, the theoretical break-even win rate is 40% before separately charged costs, assuming no flat trades. This relationship does not establish the method’s actual win rate or profitability.
Document the original range, breakout close, retest bar, planned prices and actual fills in a trading journal alongside a chronological forex strategy backtest.
Pre-trade H4 breakout checklist
| Question | Required answer |
|---|---|
| Were the reference high and low determined from eight earlier, completed H4 candles? | Yes |
| Was ATR frozen before the candidate breakout candle? | Yes |
| Did a completed H4 candle close strictly beyond the buffered boundary? | Yes |
| Was this the first qualifying retest within three completed H4 candles, with no invalidating close or overshoot? | Yes |
| Is the entry based on the next executable quote, not a retroactive chart price? | Yes |
| Is the stop based on the retest extreme and fixed ATR buffer? | Yes |
| Does the range projection offer at least 1.5R on executable quotes, with no preidentified previous-day high or confirmed swing high from the fixed 48-candle lookback blocking a long (or daily low or swing low blocking a short)? | Yes |
| Are position size, margin, trading costs, scheduled events and time-exit rules acceptable? | Yes |
If any required answer is no, the example system makes no trade. A skipped setup is not a failure to follow the strategy; entering anyway would be.
Common mistakes with four-hour breakout trading
Redrawing the box after the break. The candidate candle must not enter its own eight-bar reference range.
Treating a wick as confirmation. Only the required buffered H4 close qualifies.
Changing the retest window. A fourth- or fifth-candle retest belongs to a different setup, however attractive the chart looks.
Setting a target to manufacture a better ratio. Skip trades when the fixed projection leaves insufficient room.
Double-counting transaction costs. Spread in bid/ask fills is not a separate fee; include commissions and financing only once.
Using the same stop distance for all pairs. Check pip size, pip value and contract specifications against the pair and account currency.
Declaring a fixed win rate. An H4 timeframe has no inherent success rate; report consistently measured results instead of assuming one.
Final takeaway
A four-hour breakout is more than a spike beyond support or resistance. A testable setup needs a premarked range, completed buffered close and predefined entry and exit rules.
This eight-candle breakout-and-retest model deliberately skips marginal closes and moves that never retest. Whether that selectivity helps requires chronological testing with executable prices, transaction costs and out-of-sample validation—not a chart illustration.
FAQs
What is a 4-hour candle breakout strategy?
It is a trading approach that uses completed four-hour candles to evaluate price moves beyond a previously defined support or resistance range. The example here requires a buffered H4 close, a qualifying H4 retest and explicit entry, stop, target and time-exit rules.
How do you draw the range for an H4 breakout?
In the illustrative model, identify the highest high and lowest low of the eight completed H4 candles immediately before the candidate breakout candle. Freeze those boundaries for a qualifying setup. When no setup is active and a candidate fails, roll the window forward by one completed candle; do not include a candidate in its own reference range.
Does an H4 candle need to close above resistance to confirm a breakout?
For a close-based bullish breakout, yes. This model goes further and requires the completed close to be strictly above the premarked range high by 20% of the frozen pre-breakout ATR(14). A wick that extends above the level and closes back inside is not a valid signal.
Does a four-hour candle closing outside a range guarantee continuation?
No. The next candle can close back inside or price can reverse later. A completed close removes an intrabar ambiguity, but it cannot establish how likely the breakout is to succeed.
Is a retest required after an H4 breakout?
A retest is mandatory under the illustrative model: the first qualifying H4 retest must occur within the next three completed H4 candles and meet the stated price-band and closing rules. If that first qualifying retest fails the entry checks, record no trade rather than waiting for another attempt. An entry directly after the first breakout close is a different strategy and needs separate testing.
What does a 20% ATR breakout buffer mean?
It means adding 0.20 times the frozen pre-breakout H4 ATR(14) to resistance for a long threshold, or subtracting it from support for a short threshold. The model uses Wilder's ATR smoothing and keeps the same ATR value throughout the breakout and retest setup. With ATR at 25 pips, the buffer is 5 pips. ATR describes recent movement rather than future direction or maximum possible loss.
When do four-hour forex candles close?
The closing times depend on the broker or chart time basis. Many server-midnight-aligned H4 charts end bars at 00:00, 04:00, 08:00, 12:00, 16:00 and 20:00 server time; these are not necessarily local times. Verify the actual chart and account schedule.
Where should a stop-loss go on an H4 range breakout?
In the illustrative long retest model, the stop sits below the qualifying retest candle’s bid low by a predefined ATR-based buffer; for a short, it sits above that candle’s ask high. This stop may remain on the breakout side of the original range boundary, so triggering it invalidates the retest entry, not necessarily the whole breakout. A long stop is generally evaluated on the bid and a short stop on the ask, subject to broker rules. Calculate size from the executable entry-to-exit distance; an ordinary stop-loss does not guarantee an exact fill.
Which forex pair is best for a four-hour breakout strategy?
No pair is universally best. Historical range structure, typical spread, execution quality, session conditions and the strategy rules matter more than a particular symbol. Test a consistent data feed and the costs of the actual account.
What is the win rate of a 4-hour candle breakout strategy?
There is no inherent H4 breakout win rate. A credible figure requires a specified rule set, a complete sample of qualifying trades, realistic fees and execution assumptions, and an out-of-sample test. Evaluate net expectancy as well as win rate: a strategy can be profitable with a lower win rate if average wins sufficiently exceed average losses, and vice versa.

Amy Baily
Amy Baily is a Forex education writer with over nine years of experience in trading and market analysis. She focuses on risk management, trading psychology, and the importance of maintaining a disciplined approach to the markets.