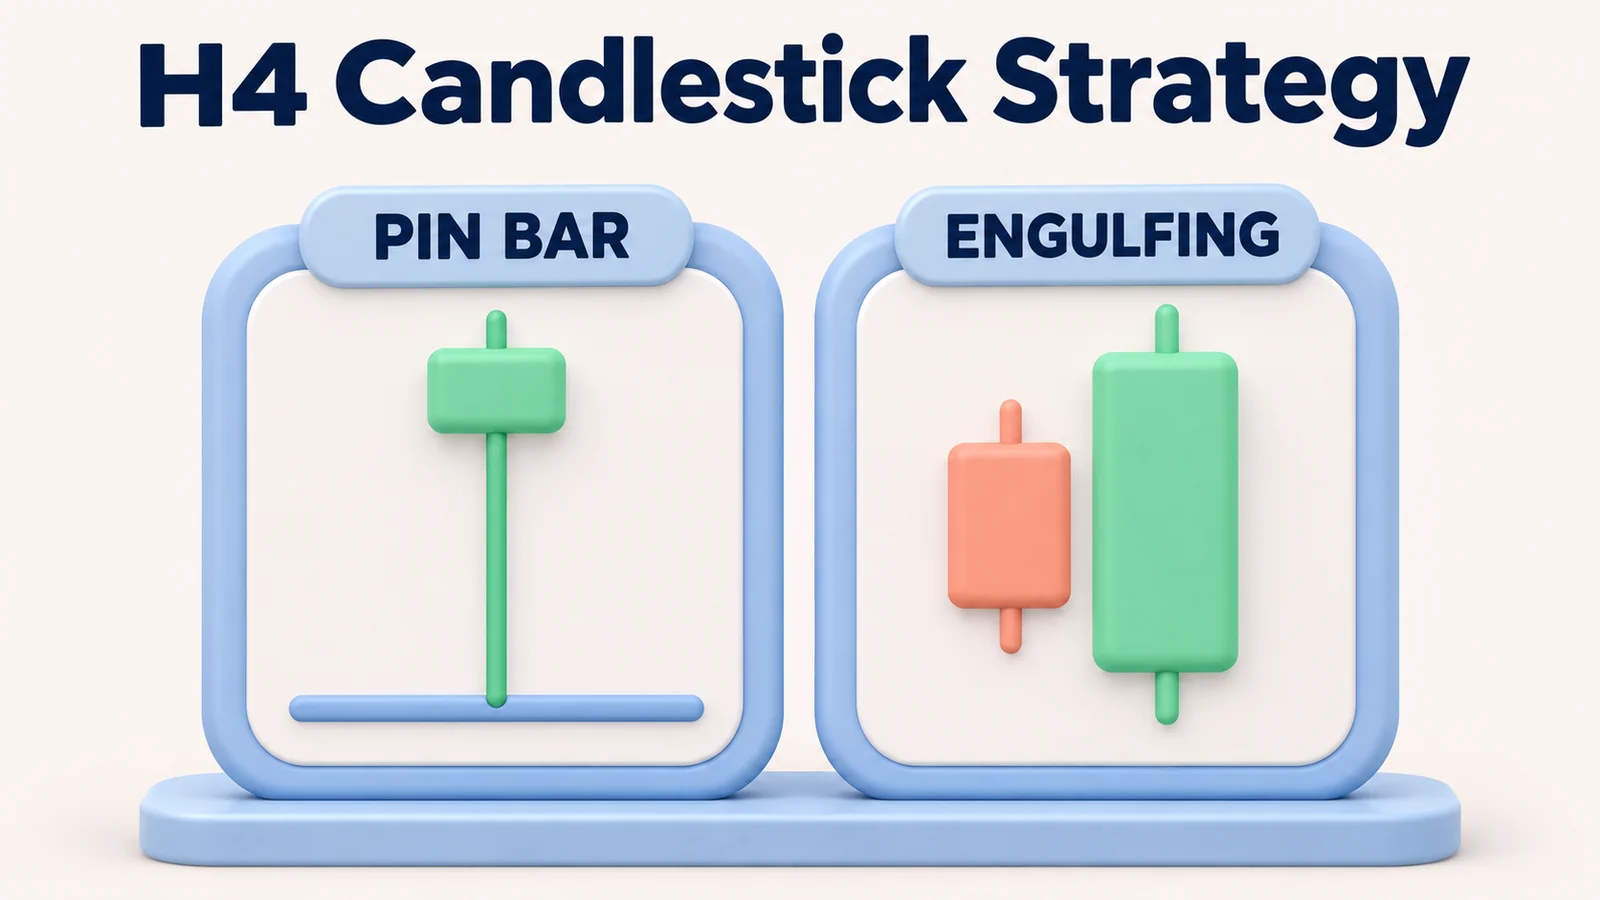
An H4 candlestick strategy uses completed four-hour candles to identify a possible change in buying or selling pressure at a price level marked in advance. A long wick may show that price tested an area and retreated. An engulfing body may show a stronger close than the preceding candle. Neither pattern, by itself, tells you whether the next move will continue.
The useful question is not simply “Is that a pin bar?” It is where the candle formed, exactly what qualifies as confirmation, and where the idea stops being valid. A rejection pin bar and a two-candle engulfing formation can each be turned into a separate, testable rule set. Recognizable shapes alone do not establish that either approach has a profitable edge.
H4 candlestick strategy at a glance
| Part of the process | Pin-bar rejection setup | Engulfing-candle setup |
|---|---|---|
| Chart | Completed four-hour (H4) candles | Completed four-hour (H4) candles |
| Price context | A previously marked support or resistance zone | A previously marked support or resistance zone |
| Pattern | One candle with a dominant rejection wick | Two opposite-colored real bodies; the second envelops the first |
| Confirmation | The next H4 candle closes beyond the pin bar's relevant extreme | The second candle closes beyond the preceding candle's high (bullish) or low (bearish), in addition to body engulfing |
| Invalidation | Beyond the pin-bar wick, plus a preselected buffer | Beyond the lower low or higher high of the two-candle pattern, plus a buffer |
| Trade decision | Only after the respective complete confirmation | Only after the respective complete confirmation |
These are two alternatives, not cumulative conditions; each can be tested independently. All sample prices, thresholds and outcomes are hypothetical.
What makes an H4 candlestick useful?
An H4 candle records four prices for its chosen four-hour interval: open, high, low and close. Its body runs between the open and close; the upper and lower wicks extend to the period's extremes. A bullish candle closes above its open. A bearish candle closes below it. The colour is less important than the actual prices.
Because each completed candle covers four hours, patterns may be easier to inspect than rapid fluctuations on a five-minute chart. But the H4 timeframe does not make a pin bar more reliable automatically. The same large wick can appear during a failed breakout, a routine pullback or unusually wide spreads. Its interpretation depends on the market context and the price used to execute an order.
For example, a bullish-looking rejection candle in the middle of a congested range may offer a wick-based stop but no meaningful level or sufficient target space. At a well-documented swing low, the same shape has clearer structural context. The distinction comes from price structure, not the name of the candle. An established swing low is part of price-action analysis: it must be visible in completed prices before the signal, rather than drawn to fit the candle afterward.
The two H4 candlestick patterns used here
1. Pin bar: a rejection wick at a known level
A bullish pin bar has a long lower wick and a relatively small body toward its upper end. Price traded lower during the four-hour period but finished away from the low. A bearish pin bar is the opposite: a prominent upper wick and a close away from the high.
Pin bars do not have one universally accepted numerical definition. To make the pattern measurable, use the following screening thresholds for a completed candle:
- Bullish pin bar: lower wick at least 60% of the candle's high-to-low range; upper wick no more than 15%; close within the upper 25% of that range.
- Bearish pin bar: upper wick at least 60% of the range; lower wick no more than 15%; close within the lower 25% of the range.
- Both directions: candle range must be greater than zero; the real body must occupy no more than 25% of the range; and the candle must touch a support or resistance zone identified before it formed. Calculate the body-to-range ratio as the absolute difference between open and close divided by the full high-to-low range.
For a bullish candle, the lower wick runs from the low to the lower of the open and close. The upper wick runs from the higher of the open and close to the high. Reverse the reasoning for a bearish pin bar; the wick lengths do not depend on whether the body itself is green or red.
The 60% wick minimum, 15% opposite-wick maximum, 25% close-position threshold and 25% body-size maximum are illustrative screening values, not established optimal settings. Test them across a defined sample and keep them fixed during each test. A volatility filter could also exclude candles whose range is extremely small relative to the pair's normal H4 range; for example, require the full range to be at least half the 14-period average true range calculated from previously completed H4 candles (ATR(14)).
2. Engulfing candle: a change across two H4 bodies
An engulfing pattern uses two completed candles with opposite body directions. In a bullish example, the first candle is bearish and the second is bullish; the second candle's real body covers the first candle's real body. A bearish engulfing pattern reverses that sequence.
The bodies—not necessarily both sets of wicks—define an engulfing pattern. The bullish rules are:
- Candle A is bearish: its close is below its open.
- Candle B is bullish: its close is above its open.
- Candle B opens at or below Candle A's close and closes at or above Candle A's open, so its body fully envelops Candle A's body.
- The completed Candle B also closes above Candle A's high. This fourth condition is an additional confirmation filter for this particular rule model, not a universal requirement for naming an engulfing pattern.
The bearish version has a bullish Candle A, a bearish Candle B, a B body that envelops A's body, and a B close below A's low. These stricter variants can produce fewer signals; whether that trade-off helps depends on testing. The distinction matters because candlestick patterns can rely on different parts of a candle: engulfing patterns compare real bodies, while pin bars emphasize wicks.
Figure 1. The illustrated engulfing pair meets the additional close-through filter without engulfing the first candle's full range.
Strategy A: H4 pin-bar rejection with next-candle confirmation
The objective is to observe a completed rejection at an established level, then require follow-through before considering an entry. A bullish setup below uses support; reverse the process for resistance and shorts.
Step 1. Mark the level before the signal
Use a support or resistance area that was visible on earlier, completed H4 candles. One repeatable approach is to select a previously confirmed swing low or high: the pivot candle has a lower low (or higher high) than two completed candles on each side. Because the two later candles are required, the swing only becomes known after they have closed.
To define zones consistently, set a support zone from the pivot candle's low to the lower of its open and close; set a resistance zone from the higher of its open and close to the pivot candle's high. This wick-to-body convention is one possible operational definition, not a universal standard. A later candle touches a zone when its high-to-low range overlaps the marked boundaries. Record both boundaries and the time the zone was marked. Do not redraw it around a later winning candle. A zone that needs repeated adjustment to include each new wick is too subjective for a clean test.
For both strategies, a support zone becomes invalid if a completed H4 candle closes below its lower boundary; a resistance zone becomes invalid if a completed H4 candle closes above its upper boundary. An invalidated zone cannot qualify a new signal merely because price later returns to it. For an engulfing setup, at least one of Candle A or Candle B must touch the premarked zone, and that zone must remain valid through both closes. If a candidate touches more than one active support zone for a long, or more than one active resistance zone for a short, reject it unless the zones were merged under a rule fixed in advance. Record the number of distinct tests, but do not impose a minimum touch count or maximum zone age unless specified before testing.
Step 2. Measure the completed pin bar
A bullish candidate must touch the premarked support zone and meet all the wick, close-position and body-size thresholds above. A bearish candidate must touch the resistance zone and meet the mirrored thresholds. Ignore the still-forming candle; until its closing price is known, its body and wick proportions can change.
The pin bar alone is an observation, not the entry trigger. A candle can close near its high and still be followed immediately by a breakdown.
Step 3. Require one more completed H4 candle
For a long, the immediately following H4 candle must close above the pin bar's high. For a short, it must close below the pin bar's low. If the next candle does not qualify, the signal expires; do not keep waiting until a later candle eventually crosses the level.
Reject the candidate if the confirming candle trades beyond the pin bar's opposite extreme before closing.
Step 4. Check the stop and available target room
After confirmation, estimate the next executable entry price, including the relevant bid/ask side and the spread. For a long, define the protective stop below the pin bar's low by a predetermined buffer. For a short, place it above the pin bar's high. The buffer may be a fixed pip amount for one pair or a consistent fraction of ATR; do not select it after seeing the outcome. A protective stop ends the individual trade if executed; it does not automatically invalidate the entire support or resistance zone, which has the separate H4-close rule described above.
Specify the stop buffer numerically before testing. One EUR/USD pin-bar variation might use four pips; another could use a fixed fraction of the previous completed H4 ATR(14). Test them separately, apply each method consistently and respect the instrument's permitted price increment. The four-pip pin-bar and two-pip engulfing buffers in the examples are hypothetical, not optimal settings.
Measure the distance from the planned entry to that stop to establish 1R. For a long, the first opposing obstacle is the lower boundary of the nearest active, premarked resistance zone above the entry; for a short, it is the upper boundary of the nearest active, premarked support zone below the entry. Identify opposing zones using the same completed swing-pivot method before the trade decision. If the entry is already inside an active opposing zone, skip the trade. Set the initial target at 2R of planned gross price movement. If the nearest opposing zone begins at or before that target, skip; if no active opposing zone lies within the 2R distance, the target-room check passes. The 2R requirement is an illustrative rule to test, not a performance forecast.
Stop orders can fill beyond their trigger price, especially in fast or thin markets. Account terms also determine how stop-loss and take-profit orders are triggered and executed; a stop-based calculation remains a plan, not a guaranteed cash limit.
Step 5. Size the position and keep exit rules fixed
Set a cash-risk budget. Estimate the loss per lot from the planned entry-to-stop distance (pips × pip value), then add predictable round-trip commissions and other per-lot fees. Deduct any fixed per-trade charges from the budget first, and do not count spread twice if it is already reflected in the executable prices. Divide the remaining budget by the estimated loss per lot, round down to the broker's trade increment, and skip the trade if its minimum size exceeds the budget. Financing, slippage and gaps can still increase the actual loss.
For the simplest version, exit at the initial stop or the planned target, whichever executes first. If you later want to trail the stop, take partial profits, or move to break-even, treat that as a new tested variation rather than adding it midway through a sample. This distinction matters more than trying to manage every fluctuation.
Worked example: a hypothetical EUR/USD bullish pin bar
Assume an established H4 support zone between 1.0975 and 1.1000. A completed four-hour candle enters that zone and finishes with these hypothetical prices:
| Pin-bar component | EUR/USD price | Measurement |
|---|---|---|
| Open | 1.1020 | Below the eventual close |
| High | 1.1035 | 55 pips above the low |
| Low | 1.0980 | Within the premarked support zone |
| Close | 1.1030 | 5 pips below the high |
| Lower wick | 40 pips | 40 ÷ 55 = 72.7% of the range |
| Upper wick | 5 pips | 5 ÷ 55 = 9.1% of the range |
| Real body | 10 pips | 10 ÷ 55 = 18.2% of the range; meets the 25% body-size cap |
| Close position | Upper 9.1% of range | Meets the upper-25% rule |
The candle meets the illustrative bullish pin-bar thresholds. The following H4 candle then closes at 1.1041, above the pin bar's 1.1035 high, without trading below its 1.0980 low. Only then does the setup qualify for the next-stage risk check.
Figure 2. The decision sequence runs from a premarked level to confirmation, then the risk check.
Suppose the next available executable long entry is 1.1043, with a planned stop at 1.0976, four pips below the pin-bar low. The difference is 0.0067, or 67 pips. This stop lies within the example's 1.0975–1.1000 support zone: it ends the individual trade if triggered and filled, but the zone is invalidated only if a completed H4 candle closes below 1.0975. If the nearest active resistance zone begins beyond 1.1177, a 134-pip target at 1.1177 provides 2R gross price room from the entry. These prices and chart conditions are fictional; they are not a historical result or current trading signal.
Assume 1.1043 is an executable ask entry, 1.0976 an eventual bid stop fill and 1.1177 a bid target fill. The 67-pip price risk and 134-pip target distance therefore reflect assumed execution prices; do not add spread again. These quotes are hypothetical, and actual fills, commissions, financing and slippage depend on the broker and market conditions.
For a hypothetical $8,000 USD account with a 0.5% planned trading-risk budget, the cash allowance is $40. On standard EUR/USD contracts, a standard lot (100,000 EUR) moves about $10 per pip. Assume an illustrative $7 round-trip commission per standard lot and no other fixed charges:
Estimated risk per standard lot = (67 pips × $10) + $7 commission = $677; raw lots = $40 ÷ $677 ≈ 0.05908 lots.
If the platform only permits 0.01-lot steps, round down to 0.05 lots. At about $0.50 per pip, the assumed stop would produce $33.50 in price loss plus $0.35 commission, or $33.85 total estimated loss. A 134-pip target would produce $67 gross price profit, or $66.65 after that commission, before financing or slippage. The 2R target is a gross price-distance rule, not a guaranteed net 2:1 return; the remaining risk budget need not be used.
The forex position size calculator is useful for checking the pair's pip value, account-currency conversion and available lot increments. Sizing a single trade is only part of forex risk management: margin requirements, correlated positions and possible gap losses still need separate attention.
Three reasons this example might become a no-trade
Reject the setup if any of these conditions apply:
- No follow-through. The next H4 candle closes at 1.1032, below the required 1.1035 pin high. The confirmation rule fails, so the signal expires.
- Insufficient target space. Previously marked resistance appears at 1.1100. From 1.1043, only 57 pips remain before that obstacle—less than the 134-pip target distance required by the 2R rule.
- Unacceptable execution. A major scheduled announcement causes spreads to widen or the next tradable quote to gap upward. The 67-pip stop estimate and target room must be recalculated; if either condition fails, the trade is passed over.
A major economic announcement can widen spreads or trigger abrupt price moves. Check the forex economic calendar before a setup rather than assuming four-hour candles are immune to news.
Strategy B: H4 engulfing close at a premarked level
Unlike a pin bar, an engulfing setup does not require a dominant rejection wick; its two-candle confirmation and stop rules should be tested separately from Strategy A. Conventionally, bullish engulfing patterns are assessed after a decline or bearish pullback, and bearish patterns after an advance or bullish pullback. This level-based model requires premarked support or resistance but has no preceding-trend filter; adding one would create a separate test variation.
Bullish engulfing rules
First, identify a support zone before the two-candle pattern forms. At least one of Candles A and B must touch that zone, and the zone must remain valid through both closes. Candle A must close below its open. Candle B must close above its open, cover Candle A's entire real body, and finish above Candle A's high. If Candle B has not closed, there is no signal.
The planned stop is below the lower low of A and B, plus a consistent buffer. Apply the common entry, target and risk rules below. A very large engulfing candle can create a wide stop and poor reward-to-risk even when it looks dramatic on screen.
Bearish engulfing rules
At previously marked resistance, at least one of Candles A and B must touch the zone, which must remain valid through both closes. Candle A closes above its open. Candle B closes below its open, its real body envelops A's body, and its close is below A's low. The planned stop is above the higher high of A and B, plus the fixed buffer.
Consider a hypothetical bearish setup with resistance premarked at 1.2025–1.2050. Candle A opens at 1.2010, reaches 1.2040, falls to 1.2005 and closes at 1.2030. Candle B opens at 1.2030, reaches 1.2035, falls to 1.1995 and closes at 1.2000. Both candles touch the valid resistance zone; B's body engulfs A's and closes five pips below A's low. Assume a next executable short entry of 1.1998 and a stop at 1.2042, two pips above the pattern high. The 44-pip risk gives a gross 2R target at 1.1910. If the nearest active support zone's upper boundary is 1.1900, the target-room rule passes; if that boundary is at 1.1950, the trade must be skipped. These prices are illustrative; transaction costs and slippage can affect the actual risk and return.
Reject an engulfing setup in an unclear range. If Candle B crosses a major range boundary, also assess the execution and false-signal risks of forex breakout trading.
Entry, target and risk rules for both directions
Consider entry at the first executable quote after Candle B closes. For a long, place the stop below the lower low of A and B by the preselected buffer; for a short, place it above their higher high. Calculate the initial risk distance from the actual entry to the planned stop. Use the same opposing-zone rule as Strategy A: the lower boundary of the nearest active, premarked resistance zone for a long, or the upper boundary of the nearest active, premarked support zone for a short. Require at least 2R of gross price room before that boundary, and set the initial target at 2R. If an opposing zone begins at or before the target—or the executable entry moves so that 2R of room is no longer available—skip the trade.
Exit at the initial stop or fixed 2R target. Do not add trailing stops, partial exits or break-even moves unless they are separately defined and tested. Size the position from the chosen cash-risk budget, stop distance and relevant pip value, rounding down to the permitted increment and accounting for spread, commission and financing. The 2R rule is an illustrative test condition, not evidence of profitability; any alternative target method should be treated as a separate strategy variation.
Worked example: hypothetical EUR/USD bullish engulfing
Assume a previously marked support zone between 1.0980 and 1.1000 and the following two completed H4 candles:
| Candle | Open | High | Low | Close | Body direction |
|---|---|---|---|---|---|
| A | 1.1010 | 1.1020 | 1.0985 | 1.0990 | Bearish |
| B | 1.0990 | 1.1030 | 1.0987 | 1.1025 | Bullish |
Candle B opens at Candle A's close and closes above Candle A's open, so its real body fully covers Candle A's body. It also closes 5 pips above Candle A's high, meeting the additional close-through condition. Candle B's low, however, is above Candle A's low; the second candle's full range therefore does not engulf the first candle's full range. This is body engulfing plus close-through confirmation, not full-range engulfing.
Suppose the next executable long entry is 1.1027, the planned stop is 1.0983 (2 pips below the pattern's 1.0985 low), and the nearest active resistance zone begins at 1.1130. The stop distance is 44 pips, so a 2R target is 88 pips above entry, at 1.1115. The target sits before the assumed resistance, leaving the required gross 2R room. If the first opposing level were below 1.1115, the defined outcome would be no trade. These prices are hypothetical, not a historical result or current trading signal; position size should be calculated using the same risk-budget method described in Strategy A.
Pin bar or engulfing: which setup fits the chart?
| Question | Pin-bar rejection | Engulfing close |
|---|---|---|
| What is being measured? | One candle's wick, body and close position | Two consecutive candles' body relationship and the second close |
| How much confirmation is required here? | One additional completed H4 candle | A strict close beyond the earlier candle's high/low within the engulfing pair |
| Where does the stop belong? | Beyond the pin bar's extreme | Beyond the extreme of the two-candle pattern |
| What makes it weak? | A long wick away from a meaningful level | A large body that finishes into nearby opposing structure |
| Can the signals be combined? | Only as a separately defined strategy | Only as a separately defined strategy |
A bullish engulfing candle can also have a lower wick, and a pin bar can be part of a larger multi-candle sequence. That visual overlap does not mean the methods are interchangeable. Selecting whichever definition looks best after a move has occurred creates hindsight bias.
When to avoid an H4 candlestick entry
Candlestick setups are most tempting when the shape is easy to recognize. The surrounding conditions should still veto the entry when necessary:
- The candle is unfinished. A wick-to-body ratio or engulfing close can change before the four-hour period ends.
- There is no premarked level. Drawing support underneath a bullish candle after a rally makes the chart appear more predictive than the decision really was.
- The candle is tiny or unusually large. A very small candle may indicate low volatility or limited price movement, but it does not by itself establish poor liquidity. Assess liquidity separately using available spread, trading activity and execution information. A very large candle may leave a stop that is expensive relative to the next obstacle.
- The market is crowded with conflicting levels. An entry in the center of a narrow range offers little room to a realistic target.
- Spread or news risk is elevated. An order might fill differently from the clean candle price displayed on a historical chart.
- The position overlaps existing exposures. Several pairs may all depend on the same direction of the US dollar, increasing total account risk.
H4 bar boundaries also depend on the broker's server time or chart timezone. A signal found on one data feed may appear different on another. Keep the same data basis while testing and verify the platform's time settings. On MetaTrader 4, select the H4 timeframe and check the relevant forex trading sessions, since liquidity and spreads can change around session openings.
How to test an H4 candlestick strategy without hindsight
Neither a candlestick diagram nor a hypothetical trade establishes a win rate or a profitable edge. Before testing, fix the level rule, pattern thresholds, confirmation, entry, stop buffer, target and costs.
- Define the data. State the instrument, broker/feed, H4 candle alignment, bid/ask convention and sample dates. Use only information that would have been available at the decision time.
- Separate the pattern sets. Log pin bars and engulfing signals in different groups. They use different confirmation and stop mechanics.
- Apply fixed filters. If a volatility minimum, session exclusion or level-pivot definition is added, apply it to every eligible signal and record skipped examples. Set numerical maximum-spread and scheduled-news exclusion rules if those filters are used, and decide in advance how to handle overlapping signals.
- Simulate the actual order. Allow for entry after a candle close, broker price increments, spread, commissions, overnight financing and possible slippage. A stop trigger is not a guaranteed fill.
- Resolve ambiguous intrabar outcomes. An H4 candle's open, high, low and close do not reveal the order in which prices occurred. If both the stop and target lie within the same candle's range, use sufficiently detailed intrabar data and the relevant bid/ask conventions to determine which was triggered first. If that sequence cannot be established, flag the trade as ambiguous and apply a predefined conservative rule, such as stop-first execution, consistently. Report how many results were affected; do not assume the target was hit first.
- Keep an untouched period. Develop the rules on one part of the data and evaluate them on a later segment you have not used to choose thresholds.
- Report the distribution of outcomes. Include sample size, net average R per trade, win and loss sizes, largest drawdown, losing streaks and results by market regime—not just a winning chart.
For each observation, note the timestamp, level identified, candle measurements, proposed order, whether the entry actually triggered, and how the trade resolved. Expectancy in R can be summarized as (win rate × average winning R) − (loss rate × average losing R), with average loss expressed as a positive magnitude; profit factor is gross profit divided by gross loss. Calculate these from trade outcomes after estimated costs, and interpret them alongside sample size, drawdown and uncertainty rather than in isolation. A forex trading journal makes it easier to preserve rejected setups alongside the winners.
For a reproducible backtest, use archived EUR/USD bid/ask data from a named feed, form H4 candles on fixed 00:00 UTC boundaries, and retain the feed version and analysis code. Reserve 2019–2022 for rule development, 2023 for validation and 2024–2025 as an untouched evaluation period. Apply each setup's rules to every candidate and retain signal-level records, costs, skipped trades and ambiguous fills. For a walk-forward extension, roll the development and evaluation windows forward; check threshold sensitivity on unused validation data rather than optimizing across the entire sample. Automated scanning or execution must still account for broker rules, spread and slippage.
A one-page H4 candlestick checklist
| Check before entry | Required answer |
|---|---|
| Was support or resistance marked before the candidate candle? | Yes |
| Is every candle used by the pattern fully closed? | Yes |
| Does the pin bar or engulfing pattern meet its own written thresholds? | Yes |
| Did the correct confirmation occur at the required time? | Yes |
| Are the stop, buffer and next obstacle defined before the order? | Yes |
| Is the gross target room sufficient under the chosen test rule? | Yes |
| Have order side, costs, event risk, sizing and other positions been reviewed? | Yes |
If any mandatory check fails, no trade is the defined outcome. A missed entry is not evidence that the conditions should be loosened afterward.
Common mistakes when reading H4 candle signals
Calling every long wick a pin bar. Measure the wick against the whole candle range and require a premarked level.
Confusing body engulfing with full-range engulfing. The close-through filter does not require Candle B's entire high-to-low range to contain Candle A's.
Entering before the H4 close. An unfinished candle may no longer meet the pattern rules when the interval ends.
Using a target based only on stop distance. Check opposing price structure before relying on the nominal 2R target.
Assuming the chosen risk percentage caps the loss. Slippage, gaps, costs and margin actions can increase actual losses.
Changing definitions after losing trades. Retuning thresholds and buffers to past outcomes invites overfitting.
Final takeaway
An H4 candlestick strategy becomes testable when its pattern, location, confirmation, invalidation and trade-sizing rules are explicit. A pin bar draws attention to a rejection wick; an engulfing candle compares how two consecutive real bodies closed. Neither signal removes the need for a relevant price level or a realistic risk check.
Decide from completed candles, record setups before their outcomes are known, and evaluate pin bars and engulfing patterns separately. If the pattern or target-room rule fails, no trade is the intended outcome.
FAQs
What is an H4 candlestick strategy?
It is a trading approach that evaluates patterns on completed four-hour price candles. A defined strategy also needs a level or market-context rule, a precise confirmation condition, a stop/invalidation point, position sizing and a plan for when not to enter.
What is a bullish H4 pin bar?
A bullish pin bar has a prominent lower wick, a smaller body near the upper part of the candle and a close away from its low. It can describe rejection of a price level, but it does not guarantee that the following candle will rise.
What is an H4 bearish engulfing candle?
It is a bearish four-hour candle whose real body covers the real body of the preceding bullish H4 candle. The additional close-through condition requires the bearish candle to close below the earlier candle’s low; this is a stricter custom filter, not a requirement of the standard body-engulfing definition.
Do an engulfing candle’s wicks also have to engulf the previous candle?
Not under the common real-body definition: the second candle’s open-to-close body covers the first candle’s body. The stricter rule set also requires Candle B to close above Candle A’s high in a bullish setup or below its low in a bearish setup, but its entire high-to-low range does not have to contain Candle A’s range. A full-range engulfing condition is different and should be tested separately.
Should I wait for an H4 candle to close before entering?
If the setup requires a closing price, yes. A candle can change its apparent shape before its four-hour interval ends. The pin-bar setup also waits for the next completed H4 candle to close beyond the pin extreme.
Is a pin bar better than an engulfing pattern for forex?
There is no universally superior H4 candle pattern. Pin bars and engulfing formations measure different price relationships and use different confirmation and stop rules. Compare them with consistent historical data, trading costs and out-of-sample testing.
Can I trade H4 candlestick patterns without indicators?
Yes. You can use previously defined swing levels, completed candle measurements and structural invalidation without a moving average or oscillator. Removing indicators does not remove the need for objective rules, execution checks and risk limits.
How many four-hour candles are there in one day?
Six four-hour periods fit into 24 hours. Actual forex charts can have different visible candles around weekends, holidays and broker session arrangements. The start and end of each H4 bar follow the chart or broker’s time basis.
What is the win rate of an H4 candlestick strategy?
No fixed win rate belongs to the H4 timeframe or to a named candle shape. A win rate can only be measured for specified rules on a defined data sample, including skipped signals, spread, fees and execution assumptions. Past results are not a forecast.
Where should a stop go on an H4 pin-bar trade?
For the illustrative long pin-bar model, it is below the pin’s low by a preselected buffer; for a short, above the pin’s high. The stop distance determines position size, but a stop order is not a guaranteed maximum loss in volatile markets.

Nathan Wong
Nathan Wong is a Forex education contributor with 15 years of trading and market-analysis experience. He specializes in broker platforms, cryptocurrency, risk management, and trading psychology, creating practical content that helps readers make informed decisions and develop realistic expectations.