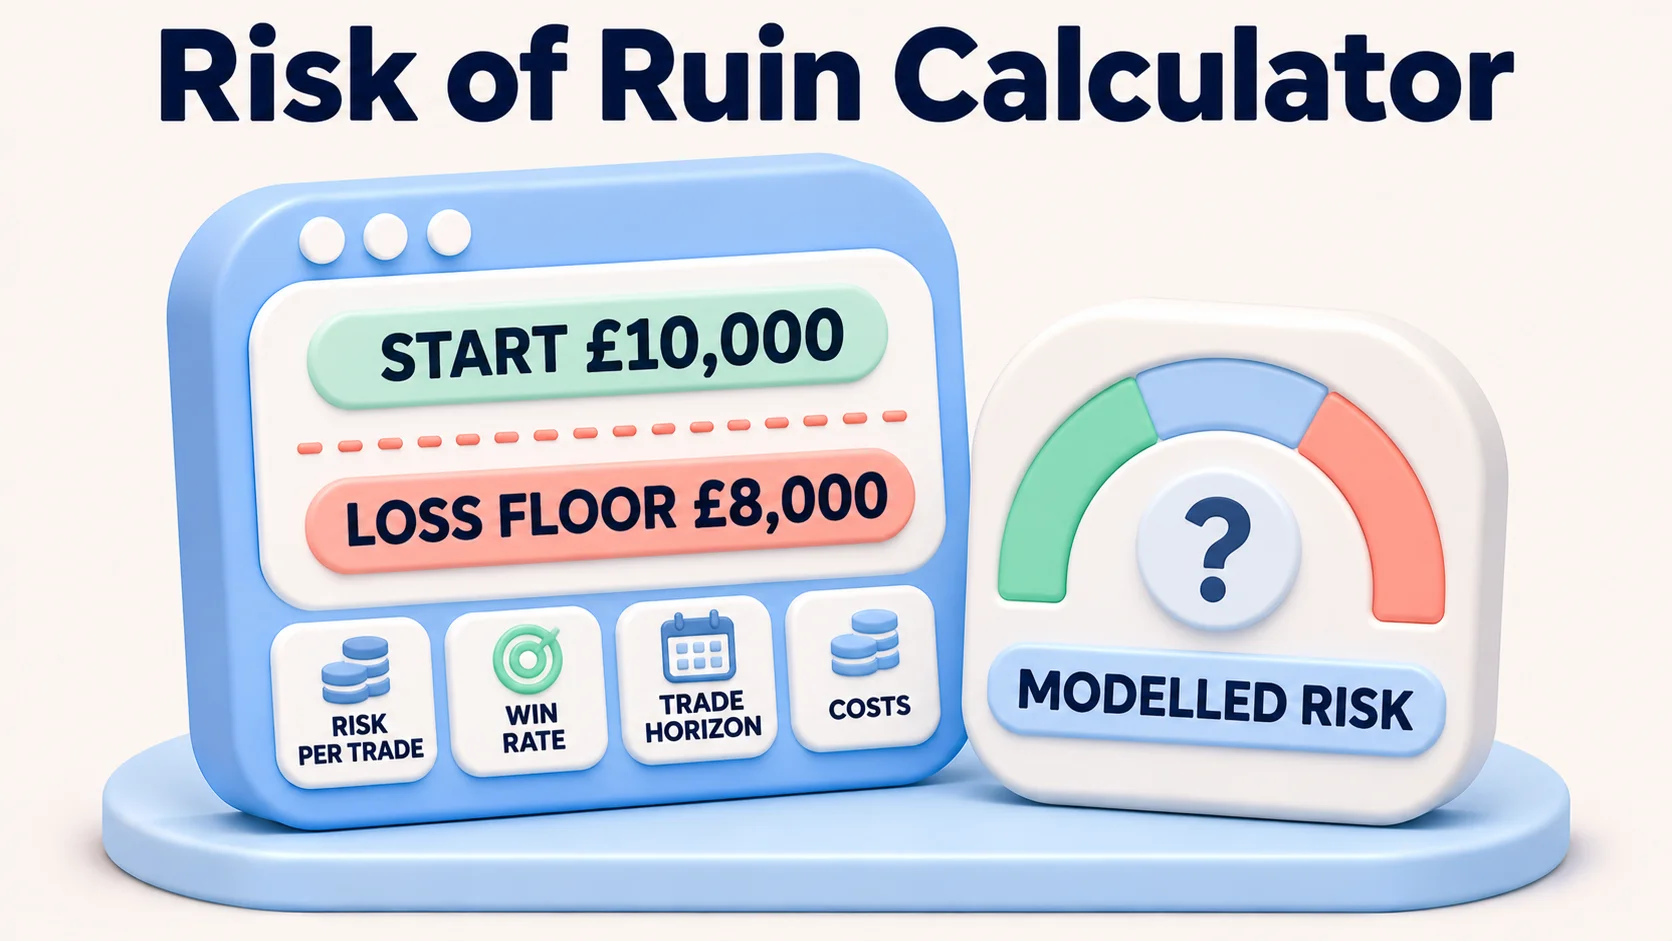
Estimate the chance that an account reaches a chosen loss threshold at least once over a fixed number of hypothetical trades. This is a model, not a prediction of your trading outcome.
The interactive calculator has not loaded. If Calculate does not update a result, refer to the methodology and worked example below.
Enter your trading assumptions
Set a hypothetical trading scenario.
8 inputs
What “risk of ruin” means here
A loss threshold is a fixed percentage drop from starting equity. With £10,000 initial equity and a 20% threshold, the model records the first time the account falls to £8,000 or less, even if it later recovers. It does not compute the chance of a 20% decline from an ever-rising peak; that is a different drawdown question. It also does not mean literal bankruptcy or a margin liquidation event.
For each trade, let f be the decimal risk fraction, b the gross winning reward in R, c the round-trip cost in R, and s the extra adverse slippage on losing outcomes in R. A nominal winning trade multiplies equity by 1 + f × (b − c); a losing outcome multiplies it by 1 − f × (1 + c + s). Gross wins happen with the entered win rate p, and losing outcomes with 1 − p.
Costs are assumed to scale with the chosen 1R every trade. The model has exact finite-horizon probability for these mathematical assumptions: it tracks every reachable win/loss count and removes paths as soon as they touch the threshold. It does not use a random simulation, a rounded formula for fixed-cash stakes, or empirical forecasts. The calculator uses the finite-horizon probability calculation described above.
Example and sensitivity
For the default assumptions (55% nominal wins, 1.5R gross reward, 1% current-equity risk, 0.1R round-trip costs, 0.1R extra slippage on losses, 20% loss threshold and 100 trades), the model estimates about 0.1366% probability of ever touching the starting-equity floor during those 100 trades. This is a result of the stated model, not a measured probability from live trading.
Try 55% nominal wins, 1.5R gross reward, risk of 1% of current capital, 0.1R round-trip cost, 0.1R slippage on nominal losses, a 20% account-loss floor and 100 trades. Compare the baseline result with the lower-win-rate and higher-risk rows. Small changes in assumed costs, win probability or trade count can change the model probability considerably.
Limitations that matter for real traders
- Independent trades and stationary parameters: Every trade is assumed to have the same win probability and payoffs, unaffected by earlier outcomes. Real strategies can change with volatility, regime, selection bias and clustering losses.
- Binary outcome model: Trades are either one specified gross win or one specified gross loss; partial fills, variable reward/loss sizes, fat tails and simultaneous correlated positions are not represented.
- Execution and financing: You choose assumed round-trip fees and losing-exit slippage in R. Financing, changing spreads and unpredictable gaps are not independently simulated; actual losses may be worse.
- Risk sizing: Stake is recomputed as a fixed fraction of current equity. This differs from using a fixed £ amount, and market minimums, lot increments or margin rules can prevent ideal resizing.
- Definition and horizon: It measures touching an initial-balance loss boundary during at most N trades; it does not measure peak drawdown, unlimited-horizon ruin, liquidation or profitability.
To calculate practical trade units instead of probability, see FXRanking’s forex position-size calculator. For stop execution, margin and portfolio exposures, see its risk-management guide.
References and methodological boundaries
Katriel, Gambler’s ruin probability – a general formula studies ruin in an integer-valued payoff model, giving theoretical background rather than validation of this fixed-fraction calculator. Myfxbook’s calculator illustrates the reader intent and uses a different methodology for its drawdown metric. CME Group’s risk example illustrates how percentage position risk changes as capital changes. None establishes your real win probability, payoff distribution or future account risk.
FAQs
What does a risk of ruin calculator measure?
This calculator estimates the probability that an account reaches or falls below a user-selected percentage of its starting equity at least once over a fixed number of hypothetical trades. It is not the probability of losing the entire account or the chance of a drawdown from a later peak.
Does a 0% result mean my trading strategy is safe?
No. A zero result can mean the selected loss floor cannot be reached within the chosen horizon under the model, or that a very small result has been rounded for display. Actual slippage, market gaps and changes in win rate or position sizing can produce worse losses.
What assumptions does the calculator make?
Each trade is an independent win or loss with a constant probability, constant gross reward-to-risk ratio, fixed trading-cost assumptions and a position risk recalculated as a percentage of current equity. Real trade outcomes are not limited to two fixed payoffs.
Why might my result differ from other ruin calculators?
Some tools use Monte Carlo simulation, fixed cash sizing, a different ruin boundary, a different horizon or different cost assumptions. This calculator uses an exact finite-horizon calculation for its specific two-outcome fixed-fraction model.
Can this calculator tell me how many forex lots to trade?
No. It estimates a mathematical threshold-hit probability. Use a position-size calculator and your actual broker contract details to work out trade units, pip value, margin requirements and execution costs.

Stephen Bennet
Stephen Bennet is a Forex reviewer and financial analyst with more than 25 years of experience in the financial markets. He specializes in reviewing brokers, evaluating trading platforms, and explaining the Forex market in a clear and practical way. Through independent, trader-focused analysis, Stephen helps readers compare providers, understand key risks, and choose platforms with greater confidence.