H4 in trading means a four-hour chart timeframe. Each H4 candlestick usually summarises price activity within a four-hour interval: where it opened, how high and low it traded, and where it closed. When trading hours are limited, a session's final candle may cover less than four hours. Traders also write it as 4H or 4-hour chart. The label describes the chart—not a particular indicator, a trading strategy, or a requirement to keep a trade open for four hours.
The four-hour timeframe is often used to read trends and price levels without watching every short-term fluctuation. It can be useful for forex analysis, but it cannot tell you where price will move next. To understand what the chart is showing, start with how its candles are constructed.
H4 meaning in trading: the essentials
| Question | Answer |
|---|---|
| What does H4 stand for? | Four hours; H means hours and 4 is the interval length. |
| What does one candle show? | The open, high, low and close (OHLC) recorded during that four-hour period. |
| Is H4 the same as 4H? | Yes. Both are commonly used for a four-hour timeframe. |
| How many H4 candles fit in 24 hours? | Six full four-hour intervals, when the market and chart data cover an uninterrupted day. |
| Is H4 a type of trading? | No. It is a chart setting that can be used with many different methods. |
| Does a trade last four hours? | Not necessarily. A trader can hold a position for minutes, days or longer while analysing H4. |
| Does every broker show identical H4 bars? | No. Server time, trading sessions and price feeds can affect candle boundaries and OHLC values. |
You will see related labels on most platforms: M15 is 15 minutes, H1 is one hour, D1 is one trading day and W1 is one week. These are ways of grouping historical prices into bars; they do not change the underlying market.
How does a four-hour candle work?
A candlestick has a body and, when prices extend beyond the body, upper and lower wicks. Its four values are:
- Open: the first recorded chart price for the interval.
- High: the highest price recorded during that interval.
- Low: the lowest price recorded during that interval.
- Close: the final recorded chart price when the interval finishes.
A candle closing above its open is typically drawn green or hollow; a close below the open is often red or filled. Colours depend on the platform's settings. The wicks show extremes reached along the way, while the body connects the open and close. The candlestick patterns that traders identify on these charts are arrangements of bodies and wicks. Their interpretation depends on the surrounding price structure, not colour alone.
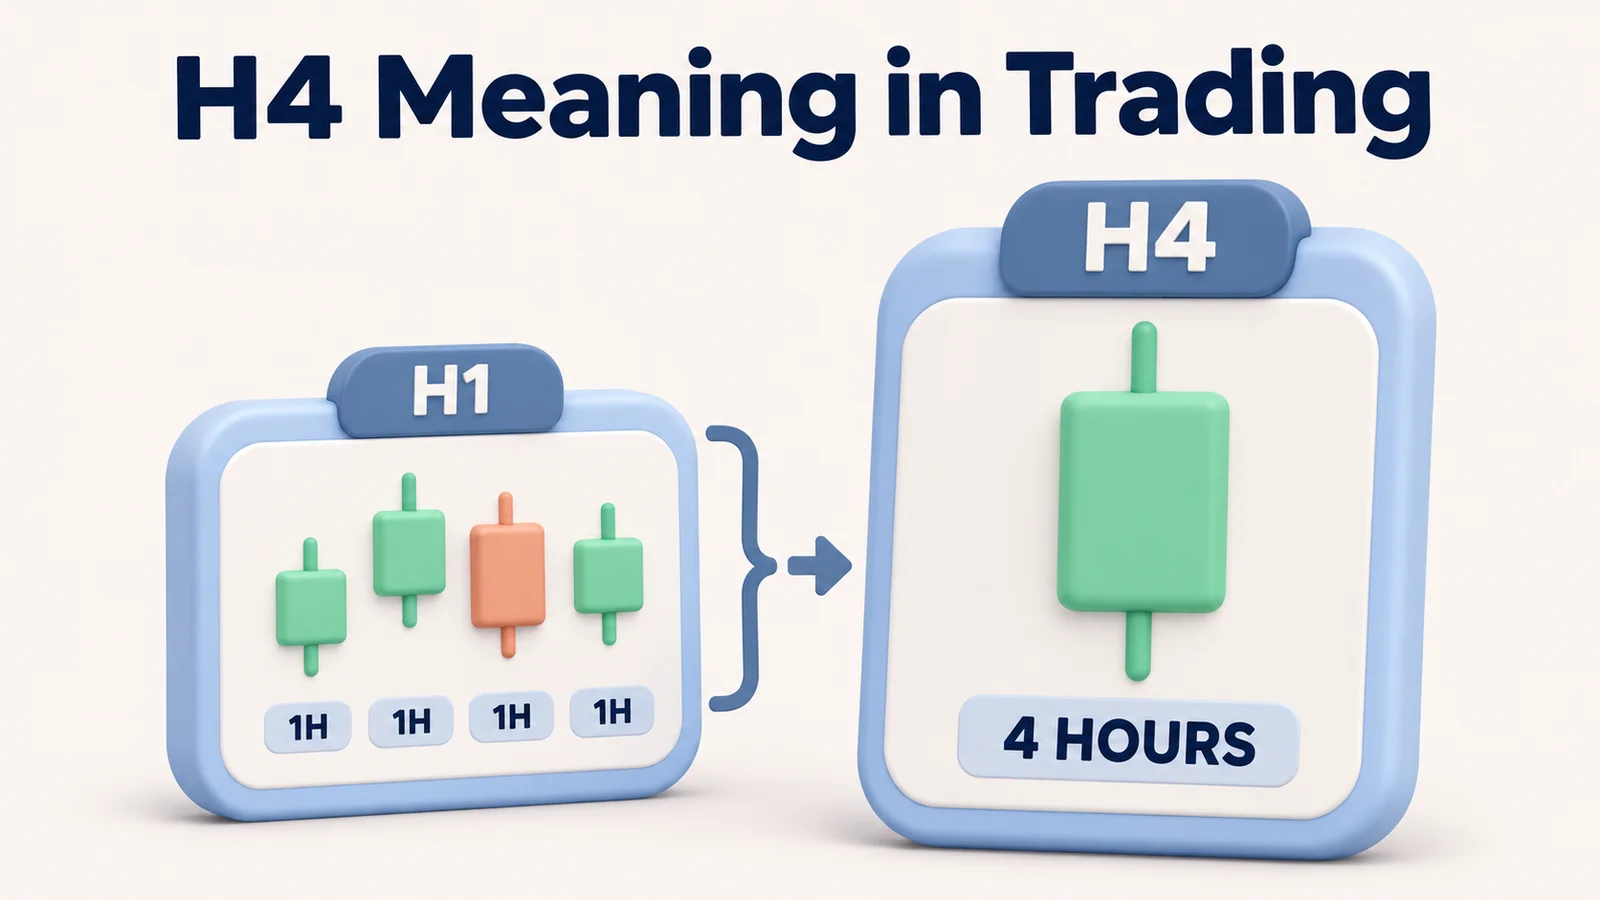
Four H1 candles make one H4 candle
When the price feed, symbol and time boundaries match, four consecutive one-hour candles combine into one completed four-hour candle. The H4 open comes from the first H1 candle, its high is the highest of the four, its low is the lowest, and its close comes from the fourth H1 candle.
A pip is a standard unit for measuring changes in an exchange rate. For most currency pairs that do not include the Japanese yen, one pip is 0.0001; for JPY pairs, one pip is generally 0.01. Some platforms also display fractional pips, sometimes called pipettes, as an additional decimal place.
Consider four fictional EUR/USD hourly candles on a chart where the H4 interval runs from 00:00 to 04:00 server time:
| H1 candle (server time) | Open | High | Low | Close |
|---|---|---|---|---|
| 00:00–01:00 | 1.0820 | 1.0834 | 1.0815 | 1.0830 |
| 01:00–02:00 | 1.0830 | 1.0840 | 1.0822 | 1.0826 |
| 02:00–03:00 | 1.0826 | 1.0850 | 1.0825 | 1.0844 |
| 03:00–04:00 | 1.0844 | 1.0848 | 1.0834 | 1.0838 |
| Combined H4 candle | 1.0820 | 1.0850 | 1.0815 | 1.0838 |
The H4 candle is bullish because 1.0838 is above 1.0820. Its body is 18 pips (0.0018), while its full high-to-low range is 35 pips (0.0035). The upper wick measures 12 pips, and the lower wick measures 5 pips. Those measurements describe the four-hour price action; they do not establish whether the next candle will rise or fall.
This example also shows why H1 and H4 can appear to tell different stories. Two of the hourly candles closed lower than they opened, yet the combined four-hour candle finished higher. The shorter movements are not erased—they are summarised in a larger interval.
How is an H4 chart different from an H1 chart?
H4 combines more price history into each candle. An hourly chart shows each step within the four-hour period; H4 compresses those steps into one set of OHLC values. Both represent the same underlying instrument, subject to the selected data feed and trading session.
Some traders find that a trend looks smoother on H4 because several short-term reversals are absorbed into a single bar. A support or resistance zone may also be easier for some traders to review across weeks rather than being obscured by dozens of small candles. These are practical preferences, not guarantees that H4 makes trends or levels more reliable. The trade-off is less detail: H4 cannot show the order in which every high and low happened inside its four hours. Even a candle with a long upper wick does not tell you precisely when the high formed.
| Chart | What each candle represents | Useful for noticing | Main limitation |
|---|---|---|---|
| M15 | 15 minutes | Short-term fluctuations and entries | Frequent noise and more decisions |
| H1 | 1 hour | Intraday swings and reactions to news | More individual movements to interpret |
| H4 | 4 hours | Broader intraday structure and multi-session trends | Hides the sequence of smaller moves |
| D1 | 1 trading day | Larger swings and long-term reference levels | Less detail about when moves occurred |
None of these timeframes is inherently more profitable or more accurate. A larger candle can give useful context while still hiding a fast reversal or a gap. Your analysis should match the type of decision you are trying to make.
How to read an H4 chart, step by step
You do not need a complicated indicator setup to learn the chart. Start with the same currency pair on H4 and follow a simple observation routine.
1. Confirm the instrument and chart settings
Check the market symbol, quote convention and selected period. A chart marked EURUSD,H4 is displaying EUR/USD candles four hours wide. A similarly named CFD (contract for difference), a different broker's feed or a chart using different session settings may produce prices and candle boundaries that do not match exactly.
2. Separate completed candles from the live candle
Look at the candle immediately to the left of the current, moving candle. That previous candle has finished, so its open, high, low and close are fixed in the saved history (subject to provider corrections). The current candle can change until its interval ends. If an observation depends on a candle's close, use a completed bar.
3. Describe the recent price structure
Look for successive swing highs and lows. Higher highs and higher lows can describe an upward sequence; lower highs and lower lows can describe a downward sequence. Overlapping swings and repeated crossings of the same level suggest a range or less distinct direction. These are descriptions of what has happened, not guarantees of continuation. Price action examines these swings and reactions in context rather than treating a single candle as an isolated signal.
4. Mark levels that price has actually reacted to
Note previous swing highs, swing lows and places where price repeatedly stalled or reversed. Treat those as areas of interest, not exact barriers that must hold. The H4 chart is useful for observing whether price has returned to such an area over several sessions. Do not call every wick a breakout without defining what would count as confirmation.
5. Add context without turning the observation into a signal
The daily chart can show whether an H4 movement sits inside a larger range or trend; H1 can reveal the shorter sequence hidden inside a four-hour candle. For example, a trader might use D1 to mark the broader direction and a major price zone, H4 to review how price reacts around that area, and H1 to inspect the shorter swings within the current H4 move. This is a way to organise observations, not a standalone entry signal or evidence of a trading edge. It does not mean one timeframe has authority to predict what happens next.
Consider a hypothetical EUR/USD chart where D1 shows a series of higher highs and higher lows as price approaches a previous resistance area. During the next H4 interval, price briefly trades above that area, but the completed candle closes back below it. H1 can show which hourly candles contained the move above resistance and the subsequent retreat. The trader can record this sequence, identify conditions that would challenge the interpretation, and assess trading costs, scheduled news and potential losses before making any decision.
A moving average can smooth the view, but its period refers to the current chart: a 20-period average on H4 uses 20 four-hour candles, not 20 daily candles. Switching to D1 changes the price observations behind the line, even if the indicator setting still reads 20.
What time do H4 candles open and close?
There is no single worldwide closing clock for every H4 chart. The boundaries used to build candles depend on the broker or data provider's bar-construction rules, server or exchange time, and trading-session settings. The timezone displayed on the chart can be a separate presentation setting: changing it may relabel timestamps without rebuilding the underlying candles.
On platforms such as TradingView, the chart-timezone control sets the timezone used to display chart timestamps. It should not be confused with the trading-session rules or bar timestamps supplied by the data provider. If close times do not match another chart, check the platform's timezone, symbol session and data settings.
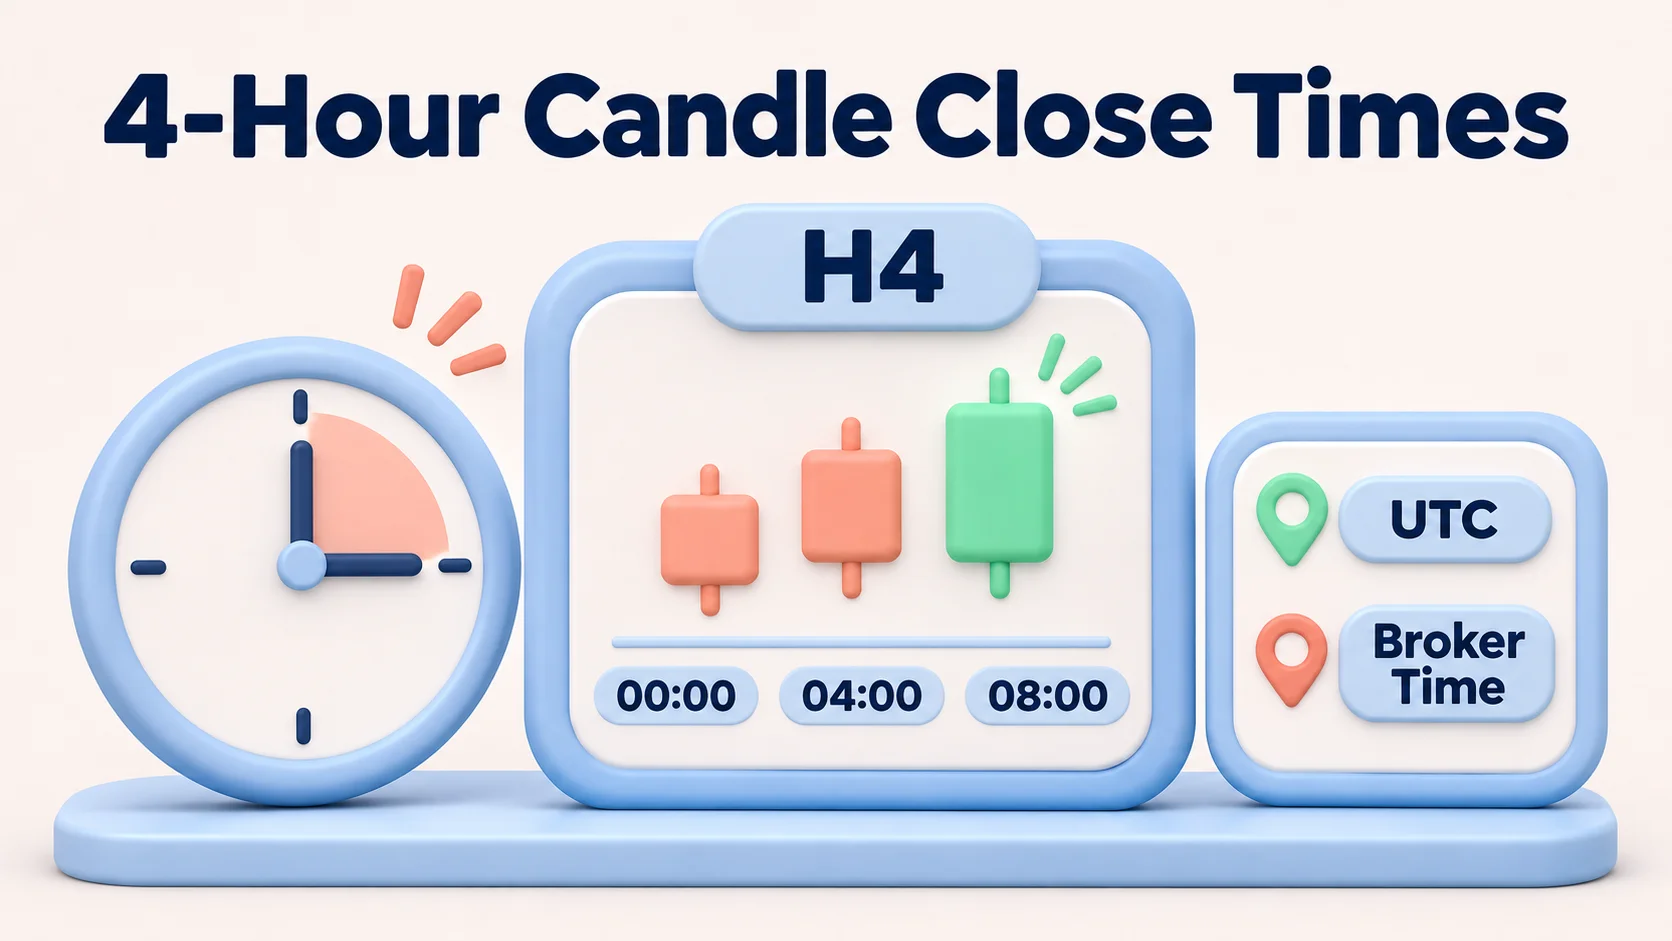
On a MetaTrader chart whose four-hour periods are anchored at 00:00 server time, the intervals are typically:
| Server-time candle | Candle closes at |
|---|---|
| 00:00–04:00 | 04:00 |
| 04:00–08:00 | 08:00 |
| 08:00–12:00 | 12:00 |
| 12:00–16:00 | 16:00 |
| 16:00–20:00 | 20:00 |
| 20:00–00:00 | 00:00 (next server day) |
These are server-time examples, not automatic New York, London or UTC times. For instance, if the server is on a fixed UTC+2 setting, a candle closing at 08:00 server time closes at 06:00 UTC. If the server shifts its offset for daylight saving time, the UTC equivalent changes. Do not assume your device timezone defines the bars you see.
Different providers also handle the trading day differently. Some brokers configure their MetaTrader chart clock so midnight coincides with the 5 p.m. New York trading-day rollover. That is a provider-specific convention, not a universal standard. The timing of forex trading sessions describes activity in financial centres; it does not replace the bar boundaries or trading hours set by your provider.
Price source also affects candle values. Bid is the price at which a trader can sell, Ask is the price at which a trader can buy, Last is the most recent executed trade, and Mid is the midpoint between Bid and Ask. On MetaTrader 5, OTC (over-the-counter) charts use Bid prices, while exchange-instrument charts use Last prices; other platforms may offer different price-source settings. Because Bid and Ask differ by the spread (the gap between those prices), charts built from different price types can show different OHLC values even when their time boundaries match. Check the price source as well as the symbol, feed and session when comparing charts.
For a precise next close, check your own platform's current bar time, broker server clock and session calendar. A chart-based countdown, where available, is more relevant than a schedule copied from another trader's screenshots.
How to find the H4 timeframe on MT4, MT5 and TradingView
The H4 setting is built into common chart platforms, although the controls look different.
- MetaTrader 4 (MT4): open the symbol's chart and select H4 from the timeframe toolbar, or use the chart's Timeframes context menu. The same MT4 chart setup process also involves confirming which symbol and quote feed you have opened.
- MetaTrader 5 (MT5): open a chart, then choose H4 in the timeframe toolbar or chart menu.
- TradingView: open a chart and select 4 hours from the interval control at the top. You may see the setting displayed as 4h.
After switching, verify both the symbol and timeframe in the chart header. Selecting H4 changes the grouping of displayed prices; it does not change trading hours, leverage, order size or the instrument you own.
Is H4 suitable for forex, stocks and crypto?
The label means the same four-hour interval across markets, but the candles available during a day can differ.
Forex: many currency pairs trade during most of the 24-hour weekday cycle, with weekly closures and broker-specific breaks. Six full four-hour periods fit within an uninterrupted 24-hour stretch. An H4 bar can also cover portions of more than one major trading session; session labels describe market activity, not universal candle boundaries. At the start and end of the week, an instrument may have fewer or partial bars depending on provider settings.
Crypto: many spot cryptocurrency markets operate continuously, so a standard four-hour crypto chart often has six bars per calendar day. Exchange outages, maintenance, timezone anchoring and differences between spot and derivatives feeds can still affect the history.
Stocks: a US stock traded only during regular exchange hours does not have an uninterrupted 24-hour session. A four-hour bar may span part of the cash session, and the final bar may be shorter. Enabling extended-hours data can change what the chart displays. Always verify the session rather than assuming a stock H4 candle behaves like a forex H4 candle.
The H4 chart is a choice of resolution, not a market, trading style or product type.
Why some traders use H4 for swing trading
A trader who holds a position through several market sessions may value H4 because it shows more movement in one candle than an hourly chart while providing more detail than a daily chart. It also allows scheduled chart reviews without reacting to every small price change. That can be convenient, but it does not reduce risk automatically.
The disadvantages matter just as much. An H4 trend can reverse before a candle finishes; stops can be hit between scheduled checks; and a position held overnight can incur financing charges or encounter sudden volatility. Forex risk management depends on the instrument, position size and possible execution loss—not on how calm the chart looks. A standard stop-loss that becomes a market order may be filled at a different available price from its trigger during fast or gapping markets; this is known as slippage. Check the provider's order terms, because execution rules and any guaranteed-stop features vary. That extra exposure is part of forex swing trading more generally, whether a trader watches H4 or another chart.
Using H4 does not require a four-hour holding period; exits still depend on the product and trading plan.
Five common H4 chart mistakes
- Treating an unfinished bar as final. A wick, candle colour or apparent breakout can change before the four-hour close.
- Assuming six identical candles appear on every day and every market. Trading sessions, weekends and provider data can create partial or missing bars.
- Copying candle-close times without checking the broker clock. A chart on another server may group trades differently, even if both are labelled H4.
- Comparing indicators without checking the chart period. EMA(20)—a 20-period exponential moving average—uses different candles on H4 than on H1 or D1.
- Confusing a cleaner-looking chart with a proven edge. A higher interval can simplify the picture while hiding intrabar moves and execution risk.
A short H4 chart practice exercise
To get comfortable with the timeframe, open a demo or read-only EUR/USD chart rather than placing a trade. Pick a completed H4 candle, then record its time and OHLC values. Switch to H1 and find the four hourly candles that made it. Compare the first open, the highest high, the lowest low and the final close with the H4 values.
Next, mark a recent H4 swing high and low, then check where that section lies on the daily chart. Finally, note the broker's displayed timezone and whether the instrument has any session breaks. If the hourly candles do not aggregate exactly, investigate missing data, different price types or a mismatch in time boundaries before drawing conclusions. Keep the observation in a trading journal as a chart-reading exercise, separate from any actual trade record.
| Observation | Record |
|---|---|
| Symbol and price source | e.g., EUR/USD, chosen demo feed |
| H4 interval and server time | e.g., 00:00–04:00 |
| Completed H4 OHLC | Open / high / low / close |
| Matching H1 candles | Four hourly bars within the same interval |
| Larger chart context | Daily range, trend or nearby level |
| Mismatch noticed? | Check time boundaries, missing bars or bid/ask feed |
Final takeaway
H4 means four hours of market data per candle. It gives a useful middle view between the detail of H1 and the broader context of D1, but it does not predict prices, define a trade's holding time or remove execution risk. The most reliable first step is simple: confirm the symbol, read completed OHLC candles, and understand the broker's four-hour boundaries before interpreting the chart.
FAQs
What does H4 mean in trading?
H4 means a four-hour timeframe. Each completed bar or candle records the open, high, low and close for one four-hour interval. It is a chart setting, not a trading strategy.
Are H4 and 4H the same thing?
Yes. Both labels commonly refer to a four-hour price chart. MetaTrader usually labels the interval H4, while other chart platforms may display 4H or 4h.
How many H4 candles are there in a day?
Six full four-hour intervals fit into 24 hours. A real chart can show fewer or partial candles when an instrument has limited trading hours, a weekend closure or provider-specific sessions.
What does H4 mean in forex compared with H1 and D1?
H1 is one hour per candle, H4 is four hours per candle, and D1 is one trading day per candle. They show different levels of detail for the same instrument, subject to data and session settings.
What is a pip in the H4 example?
A pip is a standard unit for measuring exchange-rate changes. For most non-JPY currency pairs, one pip is 0.0001; for JPY pairs, it is generally 0.01. In the EUR/USD example, a move from 1.0820 to 1.0838 is 18 pips.
What time does the H4 candle close?
It depends on the chart provider's bar boundaries and session convention. On a chart aligned to midnight server time, H4 closes are normally 00:00, 04:00, 08:00, 12:00, 16:00 and 20:00 server time, when the market is trading. These are not universal local times, and changing a chart's displayed timezone may relabel timestamps without changing the underlying candle boundaries.
Is a four-hour chart good for beginners?
It can be a manageable timeframe for learning chart structure because it shows fewer bars than short intraday charts. It does not guarantee clearer signals, lower losses or an easier path to profitable trading.
Does H4 mean I must hold a trade for four hours?
No. H4 describes how price history is grouped on the chart. The planned holding period is a separate decision based on a trading method, instrument and risk limits.
Why are H4 candles different between brokers?
Different price feeds, chart-price sources, server clocks, daily rollover conventions and trading sessions can change OHLC values or the start and end of each four-hour bar. For example, MetaTrader 5 uses Bid prices for OTC charts and Last prices for exchange-instrument charts. Compare the symbol, feed, price source, session and time boundaries before assuming one chart is wrong.
Can you use H4 on MT4, MT5 and TradingView?
Yes. MT4 and MT5 include an H4 timeframe, and TradingView offers a four-hour chart interval. Available data, price sources, candle construction and timezone displays can vary by platform and provider. Where the chart timezone is a separate display setting, changing it may relabel timestamps without changing the underlying candle grouping.

Nathan Wong
Nathan Wong is a Forex education contributor with 15 years of trading and market-analysis experience. He specializes in broker platforms, cryptocurrency, risk management, and trading psychology, creating practical content that helps readers make informed decisions and develop realistic expectations.