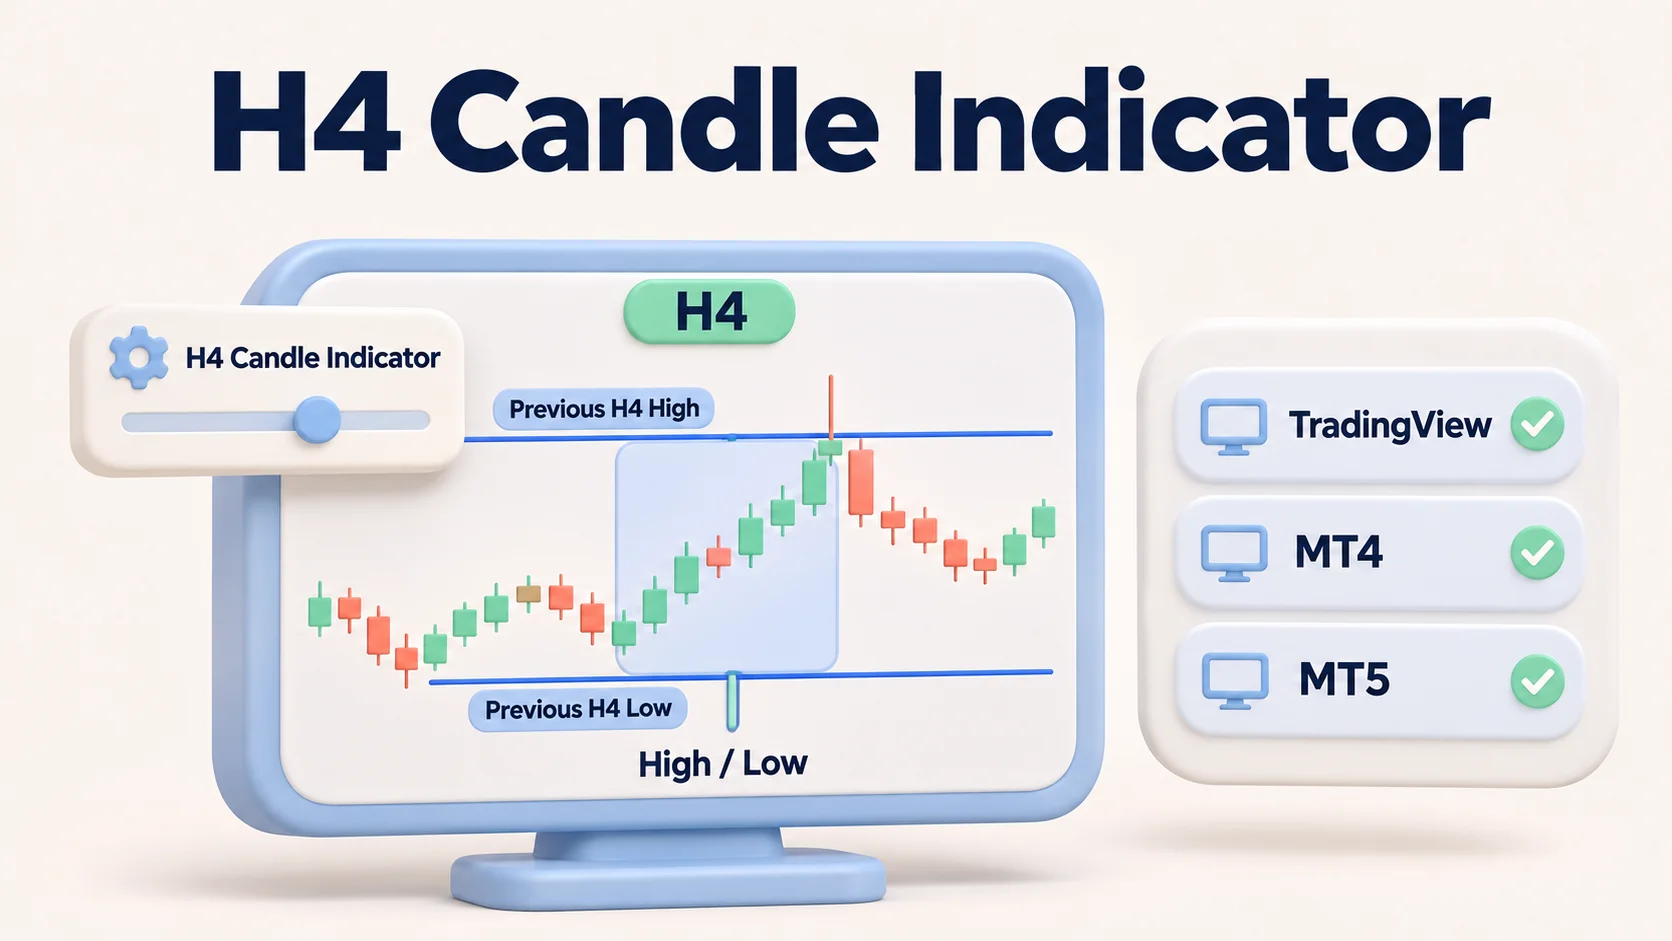
An H4 candle indicator displays information from the four-hour chart, often on a shorter timeframe such as M15 or H1. Depending on its design, it may draw four-hour candles over your existing chart, mark the previous H4 candle's high and low, show how much time is left before a candle closes, or flag a specified price pattern.
The distinction matters: an H4 candle is a chart interval, not a buy or sell signal. An indicator can make its prices and boundaries easier to follow, but its usefulness depends on which candle it reads, when its values become final, and what its alerts actually test.
What does an H4 candle indicator show?
A four-hour candle has an open, high, low and close (OHLC) for a particular four-hour interval. A basic indicator retrieves one or more of those prices and displays them in a different way. For example, a previous-H4 high/low overlay may put two horizontal lines on a 15-minute EUR/USD chart so you can see the latest completed four-hour range without switching timeframes.
You do not need a custom indicator simply to open an H4 chart. TradingView and MetaTrader include a four-hour chart period. A custom indicator becomes useful when you want four-hour information visible while studying finer price movements. The body and wick of a candlestick still represent the same four prices, whether the candle appears on an H4 chart or as an overlay. Spot forex trades through most of the working week; stocks, futures and other session-based markets may have partial H4 bars or different trading hours, so check the instrument’s calendar.
Common H4 indicator types
| Indicator type | What appears on the chart | Main question it helps answer |
|---|---|---|
| H4 candle overlay | Larger four-hour candle bodies and wicks over smaller chart candles | What does the wider price structure look like? |
| Previous H4 high/low | Levels from the last completed four-hour candle | Where are the established reference levels? |
| Current H4 range | Developing high, low and sometimes open or midpoint | How is the unfinished four-hour candle developing? |
| H4 close countdown | Time remaining until the chart's next four-hour boundary | When is the current candle expected to finish? |
| H4 sweep or pattern alerts | Labels for a defined crossing, reclaim or candlestick condition | Has a particular rule occurred, and was the candle confirmed? |
A Candle Range Theory (CRT) overlay is one example of the last category. CRT is a way of interpreting price moves around a reference candle's range, not a standardised indicator calculation. Some implementations plot the previous H4 range, its 50% midpoint and markers when price passes a boundary or closes back inside it. The exact definition of a “sweep” depends on the script, including whether it uses an M5, M15 or H4 close. A marker describes a defined price event; it does not establish that institutional liquidity was taken or that a reversal will follow. An H4 moving average, by contrast, smooths a sequence of four-hour prices rather than simply marking a single candle’s range.
Completed H4 candles versus the current four-hour candle
The most important setting is whether the indicator uses a finished H4 candle or the one still forming. This distinction is easy to miss because the two can look identical in a static screenshot.
Suppose the last completed H4 EUR/USD candle had:
- High: 1.0860
- Low: 1.0820
- Midpoint: (1.0860 + 1.0820) ÷ 2 = 1.0840
The high-to-low distance is 40 pips on EUR/USD (one pip is 0.0001). The midpoint is halfway through that range; it is a reference price, not a prediction.
Those values remain known for the entire next H4 period. Meanwhile, the new H4 candle is unfinished. It might trade up to 1.0878 and then close at 1.0850. A live-range indicator correctly shows the new high while the candle forms, but a rule requiring an H4 close above 1.0860 has not been satisfied.
The wick above 1.0860 remains part of the completed candle; what changes is whether the candle closes beyond the level. A wick breach and an H4-close breakout are separate events. This is why it helps to distinguish the confirmed range from a live-range display, particularly when assessing breakout and false-breakout behaviour.
Does that mean the indicator is repainting?
Not necessarily. A moving high, low or close on a currently forming candle is normal. The high can rise as new prices arrive, the low can fall, and the close is simply the latest price until the period ends. An indicator is more concerning when it plots a historical signal as if a final higher-timeframe value had been known before that H4 candle closed, or when earlier signals disappear after a reload.
For trustworthy comparisons, check three things:
- The source candle: Is the value from the current H4 bar or the previous completed one?
- The signal time: Does an alert occur as soon as price crosses a level, at a smaller candle's close, or at the actual H4 close?
- The historical record: After a refresh, would the plotted level or signal still have been available at that point in time?
Incorrect higher-timeframe data requests can make final H4 values appear on historical chart bars before those values were available in real time. The same timing question matters on MT4, MT5 and in backtests.
How to add an H4 candle indicator on TradingView
If you only want to see H4 candles, select 4 hours from the chart's interval menu. For an indicator that overlays H4 information onto smaller candles, the process is different:
- Open the instrument and choose a shorter chart interval, such as 15 minutes or 1 hour.
- Open Indicators, then search for terms such as H4 high low, 4H candle overlay or higher timeframe candles. Review each script's description rather than relying on its name.
- Check the settings for the source timeframe. In Pine Script, four hours is represented as
240minutes in a timeframe string. - Choose between previous completed and developing/current H4 data when the script offers that option.
- Compare the overlay against the native four-hour chart for the same symbol and data feed. Verify both levels at an actual H4 boundary before relying on an alert.
Community-built scripts can differ substantially. One may draw the entire H4 candle; another may draw only a high/low box; another may label a sweep when a smaller timeframe candle closes. These are not interchangeable features, and a popular or visually polished script is not necessarily a more accurate one.
How to use an H4 indicator on MetaTrader 4 (MT4)
MT4 includes the H4 chart period, but a display of four-hour candles on an M15 chart is typically a custom indicator. Start with the native H4 chart to understand the feed's actual candle boundaries, then add an overlay if it improves your workflow.
Open MT4’s Navigator (Ctrl+N on desktop), find the indicator in its built-in or custom group, and drag it onto the chart.
If you download a custom MT4 indicator from a trusted source:
- In MT4, choose File → Open Data Folder and open
MQL4/Indicators. - Place an MT4-compatible
.ex4executable in that folder. If you have an.mq4source file instead, save it there, open it in MetaEditor (F4from MT4) and compile it (F7) to produce an.ex4executable. An uncompiled source file cannot run as an indicator. - Refresh the indicator list in Navigator, or restart MT4 if needed. If compilation fails, check MetaEditor’s error messages before trying to attach the indicator.
- Attach the indicator to an M15 or H1 chart and inspect settings such as source timeframe, number of H4 candles, high/low lines, candle colours and current-versus-closed bars.
- Check its readings against an H4 chart from the same broker server. Compare the high and low of the last completed H4 bar, rather than those of the still-forming candle.
In MQL4, iHigh(Symbol(), PERIOD_H4, 1) and iLow(Symbol(), PERIOD_H4, 1) retrieve the last completed H4 candle’s levels; shift 0 refers to the still-forming bar. If the necessary price history is unavailable, these functions can return zero, so check that the data has loaded before using either value.
Avoid treating a downloaded file as trustworthy just because it plots neatly. Examine the provider, file permissions, whether it requires external components, and the difference between an indicator and an Expert Advisor. An indicator meant only to draw levels has no need to place trades on your behalf. Using a separate chart template for the overlay can keep the MT4 trading workspace clear when switching between price analysis and order entry.
How to use H4 indicators on MetaTrader 5 (MT5)
The idea is the same in MT5: open an H4 chart directly, or use a custom indicator on a shorter chart to display four-hour information. MT5 indicators must be built for MQL5. An MT4 .ex4 file is not an MT5 .ex5 file and cannot simply be renamed for compatibility.
- Open the chosen chart, then File → Open Data Folder →
MQL5/Indicatorsfor custom files. - Add an MT5-compatible
.ex5executable. If you have only an.mq5source file, open it in MetaEditor (F4) and compile it (F7) to create the.ex5file. Source files alone are not runnable indicators in Navigator. - Refresh the Navigator indicator list, attach the indicator, and select the H4 source period where available.
- Inspect its display settings and, if provided, its Visualization tab, which can restrict which chart timeframes display the indicator.
- Compare its closed-H4 values against MT5's native H4 chart, checking the last completed candle rather than the live one, before configuring alerts or testing a strategy.
In MQL5, iHigh(_Symbol, PERIOD_H4, 1) and iLow(_Symbol, PERIOD_H4, 1) similarly request the last completed H4 high and low. Price history may need to load before these calls return valid values; check for errors or missing data rather than interpreting zero as a valid price.
MT5’s indicator settings support timeframe-based display visibility, although custom products may use different names for their inputs, alerts and calculations.
Reading an H4 high/low indicator: a complete example
Assume you are studying EUR/USD on an M15 chart. The latest completed H4 candle set a high of 1.0860 and a low of 1.0820. Your high/low indicator should keep those reference values unchanged through the next four-hour interval if configured to use the previous completed bar.
| Observation | Indicator reading | Correct interpretation |
|---|---|---|
| Price trades at 1.0855 | Below the previous H4 high | Price is approaching a known level; no breakout has occurred. |
| An M15 candle briefly reaches 1.0878 | Above the reference high | The previous high has been exceeded intrabar, but the H4 candle is not necessarily closed above it. |
| The new H4 candle closes at 1.0850 | Below 1.0860 | The price made a wick above the reference high and closed back beneath it. |
| The following H4 period begins | Prior-H4 high/low lines update | The new reference values now come from the H4 candle that just finished, not the older one. |
This is an illustrative data sequence, not historical EUR/USD performance. A sweep label might appear in the third row if the script defines a sweep that way. A completed-close breakout signal should not appear because the H4 close remained beneath 1.0860. Neither outcome proves where the next candle will go.
Decision example: Suppose a trader's written rule permits a breakout entry only after an H4 candle closes above the previous H4 high. Trading at 1.0878 during the candle does not meet that rule; the final 1.0850 close means no breakout entry under this plan. Even an M15 close above 1.0860 would not substitute for the required H4 close. The trader records the observation and reassesses the next period instead of treating the wick as confirmation.
Position sizing is a separate decision. If a different setup met a trader's entry rules and used a 40-pip stop with a $100 price-move risk budget on a USD-denominated EUR/USD account, the planned exposure would be $2.50 per pip. At approximately $10 per pip for a standard 100,000-unit EUR/USD lot, that is 0.25 lots before trading costs or slippage. These are hypothetical inputs, not suggested entry or stop levels; verify the pip value, contract size and actual risk with your broker.
A separate price-action assessment can consider the context: was the market trending, at a daily level, or inside a range? Indicator lines only mark historical prices; the surrounding price action and market structure determine how a trader might interpret them.
Settings that matter more than indicator appearance
When comparing H4 candle tools, the following settings determine whether their output is meaningful:
| Setting | Preferred question to ask | Consequence if ignored |
|---|---|---|
| Source timeframe | Is it explicitly H4/240 minutes? | A lower-timeframe box may be mistaken for a four-hour range. |
| Bar selection | Is it the previous closed bar or the current open bar? | Developing values may be treated as confirmed. |
| Chart/session alignment | Does the overlay use the same feed and H4 boundaries as the comparison chart? | Two platforms may draw different highs, lows and closes. |
| Alert trigger | Is the trigger intrabar, lower-timeframe close, or H4 close? | Alerts may sound before a four-hour confirmation exists. |
| History handling | Do earlier markers change after a refresh? | Historical charts may imply information unavailable in real time. |
| Chart interval | Is the tool designed for M5/M15/H1, or for native H4? | Higher-timeframe requests may be used in unsupported contexts. |
| Drawn objects | Are old lines intentionally extended, deleted or recalculated? | A disappearing box may be mistaken for a market signal. |
When choosing a community indicator, check that the calculation rules and alert timing are documented, that prior signals can be reviewed after reloading, and that the developer and any required external components are identifiable. Source availability can help with inspection but does not by itself prove correctness; validate the tool on your own feed.
Candles also depend on when a chart defines the trading day. A broker's H4 bars may differ from another broker's even when both label them H4. Comparing forex trading sessions and overlaps can help explain changes in liquidity, but session-opening times are not themselves universal H4 candle boundaries.
For example, a bar labelled 00:00–04:00 on a UTC+0 server covers 00:00–04:00 UTC, while a bar with the same server-time label on a UTC+2 server covers 22:00–02:00 UTC (starting on the previous UTC date). Because these bars group different price movements, their highs and lows can differ. Some forex brokers adjust their server offset for daylight saving time, and US and European clock changes do not always occur on the same dates. Compare the actual bar timestamps and current server offset; merely changing a chart’s displayed timezone does not necessarily change the OHLC data.
Common H4 candle indicator problems and fixes
The H4 high/low lines disagree with another platform. Confirm both charts show the same currency pair, quote provider and time interval. Different broker servers can use different four-hour boundaries, and the bid/ask stream may differ. Compare the actual H4 timestamps before judging either tool incorrect.
The level moves every few minutes. The indicator may be plotting the current H4 candle, not the preceding completed candle. Look for a setting such as Current candle, Shift, Bar 0 or Closed bars only. In many MetaTrader indicator implementations, bar 0 is forming and bar 1 is the last completed H4 candle, although the input labels depend on the developer.
A signal vanished after refresh. Check for higher-timeframe lookahead, live-bar updates and rules that relied on intrabar information. Test whether a signal appears only after its stated confirmation candle closes. Historical screenshots alone are insufficient.
A countdown does not match another timer. Check the market's session and the broker's bar opening time. A generic four-hour countdown may be correct for one feed but wrong for an instrument with an exchange session, weekend interruption or a different server offset.
The indicator does not appear in MT4 or MT5. Verify the platform-specific file type and folder, compile source files if required, refresh Navigator and inspect visibility settings. MT4 and MT5 custom indicators are not binary-compatible.
Too many lines make the chart harder to read. Limit the display to levels relevant to your decision—perhaps previous H4 high and low—before adding midpoints, multiple historical ranges and signal labels. A cleaner chart is often easier to review consistently.
Can an H4 indicator improve a trading strategy?
It can make a process more consistent, but an overlay does not establish a statistical trading edge. An indicator showing the last completed H4 high and low helps a trader record the same reference levels each time; it cannot guarantee support, resistance, a liquidity sweep or a successful breakout.
A fair test should specify the indicator version and settings, data source, timeframe alignment, signal time and execution assumptions. Record every occurrence, including failed moves and periods with no signal. If you change from previous-H4 levels to live-H4 levels, you have changed the input and must treat the results as a different test.
For a reproducible test, use a fixed procedure:
- Define the rule: Write down the exact H4 level, candle-close condition, entry trigger, invalidation, exit and maximum risk.
- Fix the inputs: Record the platform, indicator version, symbol, broker feed, H4 boundaries and all parameters before testing.
- Include realistic execution: Account for spread, commission, possible overnight financing, slippage and gaps rather than assuming every alert fills at its chart price.
- Separate your samples: Develop rules on one historical period, evaluate them on different out-of-sample data, then forward-test without changing the rules.
- Record all outcomes: Include failed signals, quiet periods, trade frequency and the market conditions in which the rules were tested.
Report sample size, win rate, average gain and loss, expectancy per trade, profit factor and maximum drawdown, alongside results across trending and ranging conditions. A handful of selected chart examples is not enough to demonstrate a repeatable edge.
Before translating any indicator observation into a position, calculate the cash risk based on a stop distance rather than using a fixed lot size. The forex position size calculator can help estimate a lot size from your stop distance and cash-risk limit; verify the inputs against your broker’s contract specifications. A forex trading journal can preserve the original signal time, source candle, settings, spread and final result. These records are more informative than a selection of profitable-looking chart examples.
A practical H4 indicator checklist
Before relying on an H4 overlay or alert, confirm that:
- The source timeframe is H4 (240 minutes) and the chart/feed is the one you intend to use.
- You know whether each displayed value belongs to a completed or developing candle.
- The indicator's high and low agree with the native H4 chart at an actual bar boundary.
- A purported H4-close alert cannot fire based solely on an earlier M15 or H1 close.
- Historical signals remain consistent after reload and do not use future H4 values.
- You have written a separate plan for entry, invalidation, size and costs; the indicator itself is only an information tool.
The simplest useful starting point is often two lines: the last completed H4 high and low. Once their timing and meaning are clear, decide whether overlays, midpoints or pattern alerts genuinely add information to your process.
FAQs
What is an H4 candle indicator?
An H4 candle indicator displays information calculated from four-hour chart bars. Depending on the tool, it may draw H4 candles on a smaller chart, mark the previous H4 high and low, show the developing candle, or flag a defined price condition.
Is an H4 indicator already built into TradingView?
TradingView includes the 4-hour chart interval, but a candle overlay or previous-H4 high/low display on an M15 or H1 chart generally needs an indicator or script. Open Indicators and check each tool’s description and settings.
How can I show H4 candles on a 15-minute chart?
Use a higher-timeframe candle overlay configured for H4 (240 minutes) on the 15-minute chart. Verify the overlay against the native H4 chart for the same symbol and data feed. A simple prior-H4 high/low overlay is a lighter alternative.
What is the difference between current and previous H4 high/low?
The previous H4 high and low are fixed prices from the latest completed four-hour candle. The current H4 high and low are still developing: the high may rise and the low may fall before that candle ends.
Do H4 candle indicators repaint?
Some displays correctly update while an H4 candle is open; that is normal. Repainting becomes more problematic when historical signals imply that final H4 information was available before the candle closed. Verify the indicator’s data requests and signal timestamps.
Can an MT4 H4 indicator be installed in MT5?
Not by simply copying or renaming its executable file. MT4 indicators are built for MQL4 and typically use .ex4 or .mq4 files; MT5 indicators use MQL5 and .ex5 or .mq5 files. Use a compatible version for each platform.
Why are the H4 candle levels different between brokers?
Four-hour bar boundaries can vary with broker server time, daylight saving changes, trading-session settings and the price feed. Compare the actual H4 timestamps, current server offset and instrument quotes before deciding that an indicator is displaying the wrong levels.
Can an H4 high/low or sweep indicator predict the next candle?
No. An H4 level or sweep marker records or interprets price behaviour according to a rule; it does not prove that price will reverse, continue, or reach a target. Any trading use requires separate testing and risk controls.

Jake Robins
Jake Robins is a Forex and cryptocurrency education contributor with over 10 years of experience helping readers better understand the financial markets. His work covers risk management, technical analysis, trading psychology, broker platforms, and scam awareness. Through clear, practical guidance, Jake helps traders approach the markets with greater discipline, caution, and confidence.