


















































































































What Is Volume in Forex?
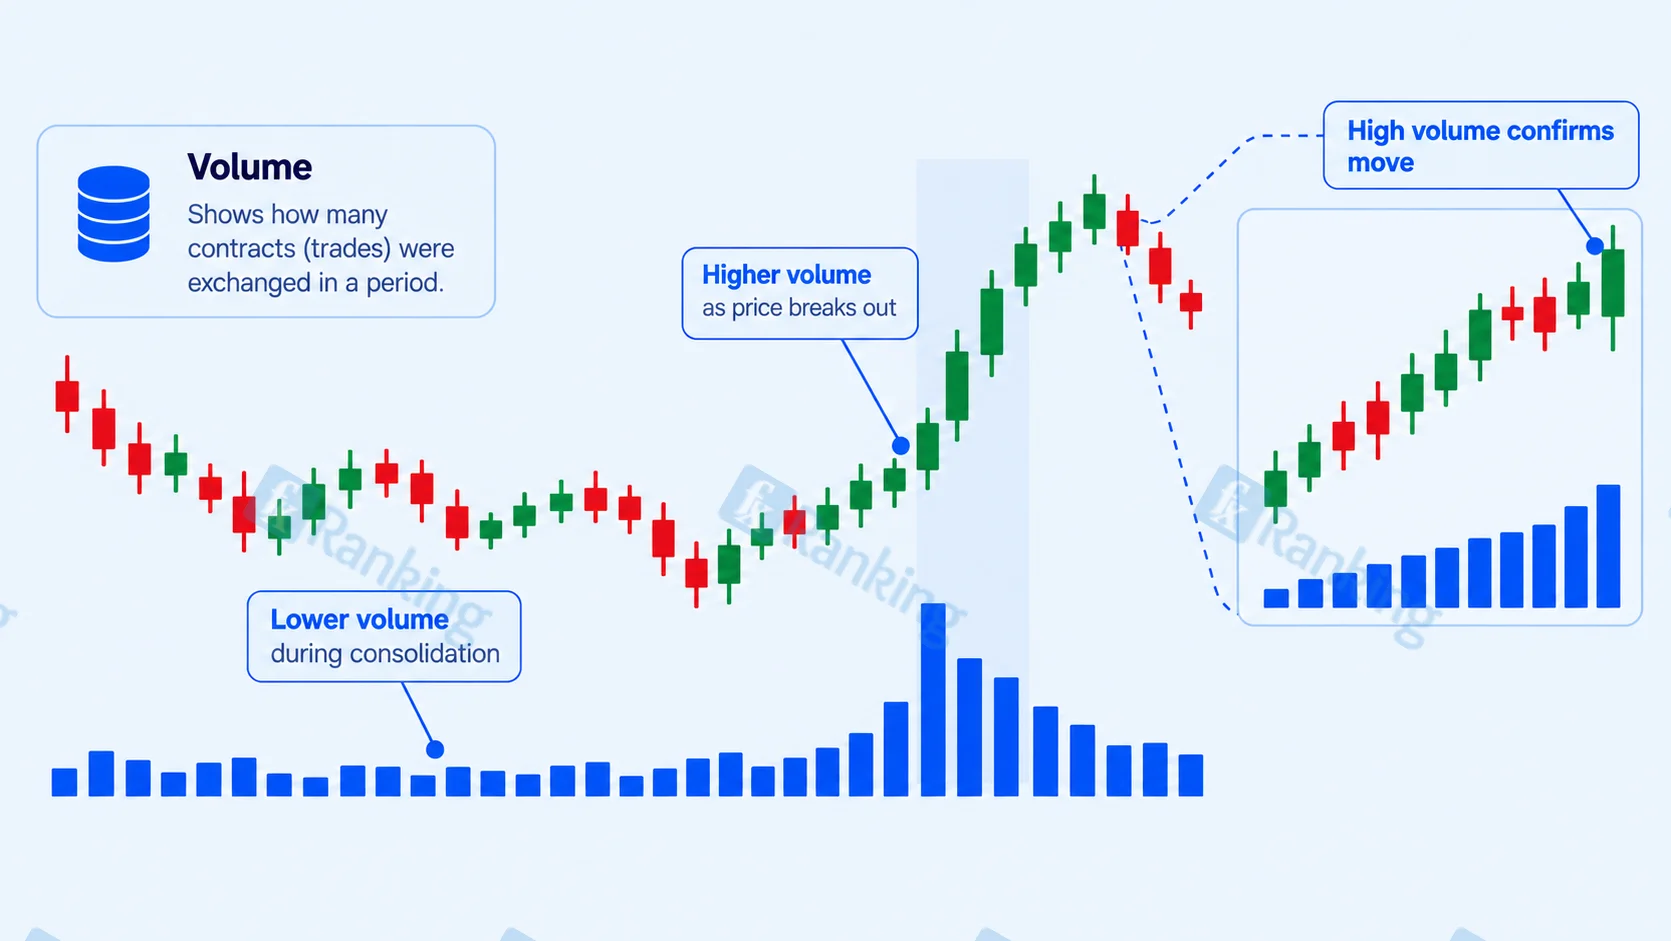
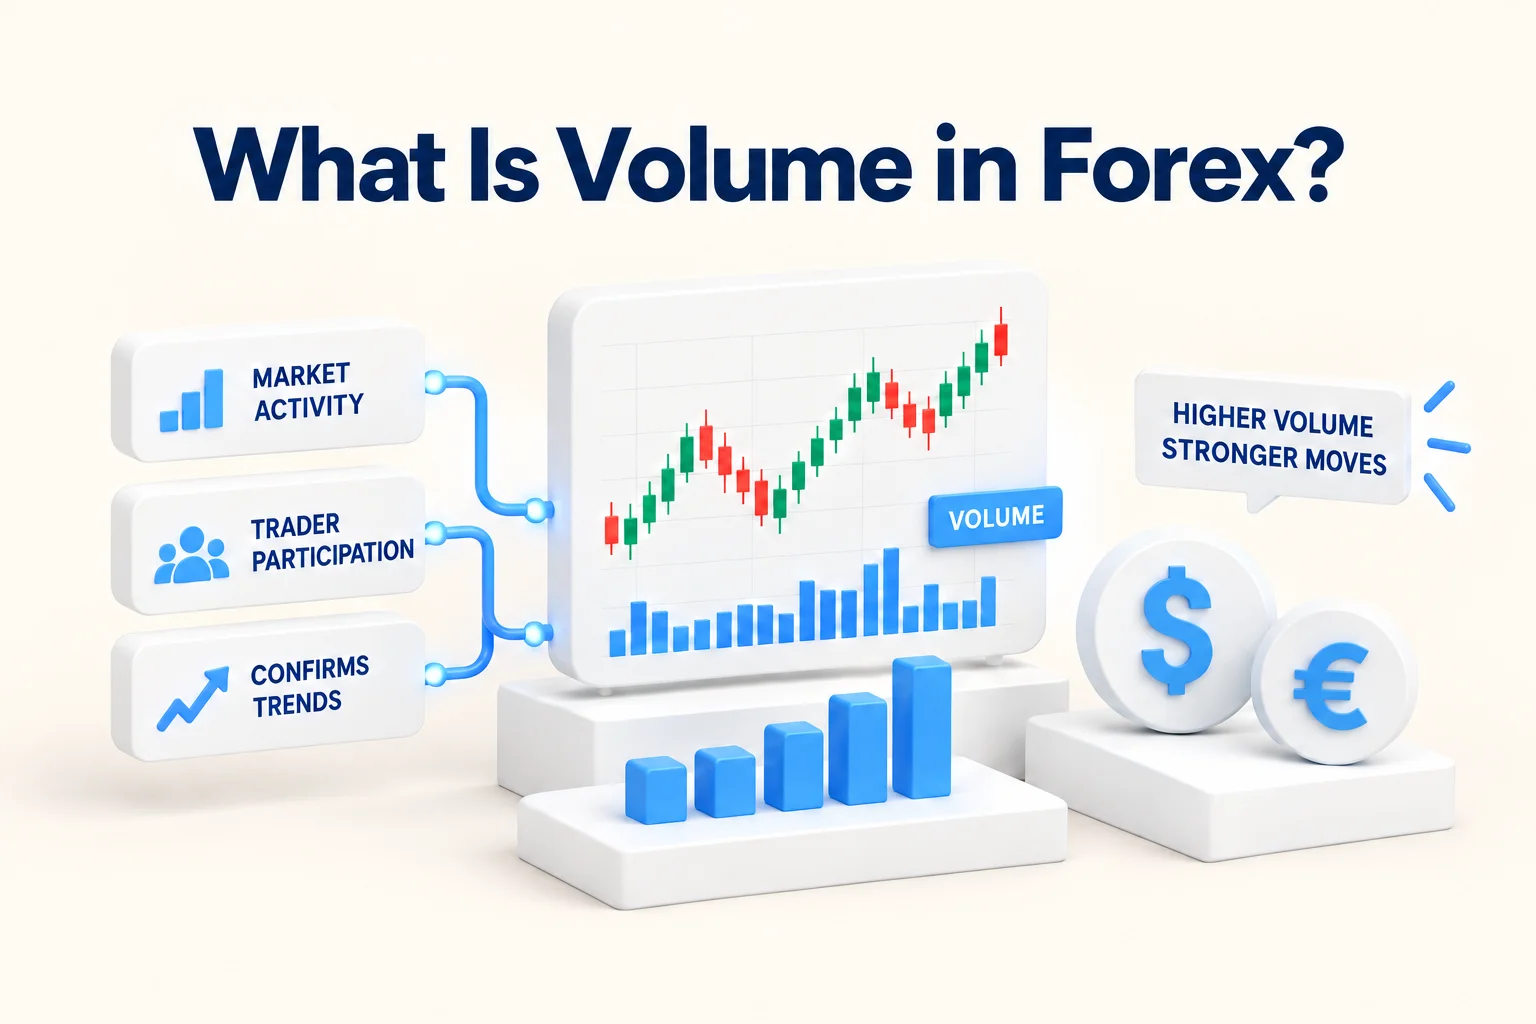
In simple terms, volume refers to the amount of trading activity associated with a currency pair over a particular period. Because spot forex is traded over the counter rather than through one central exchange, retail traders usually see tick volume: the number of price or quote changes recorded during each candle.
That distinction is the starting point for understanding volume in forex trading. A volume reading of 1,000 on a EUR/USD chart does not mean that exactly 1,000 lots, euros, or trades changed hands. Instead, on most retail platforms it means that the price feed registered a certain number of updates during that candle.
This makes forex volume useful, but different from the volume shown for a listed stock or futures contract. Traders need to know what their platform is actually measuring before using a volume indicator to interpret price movements.
Why Volume in Forex Works Differently From Stocks
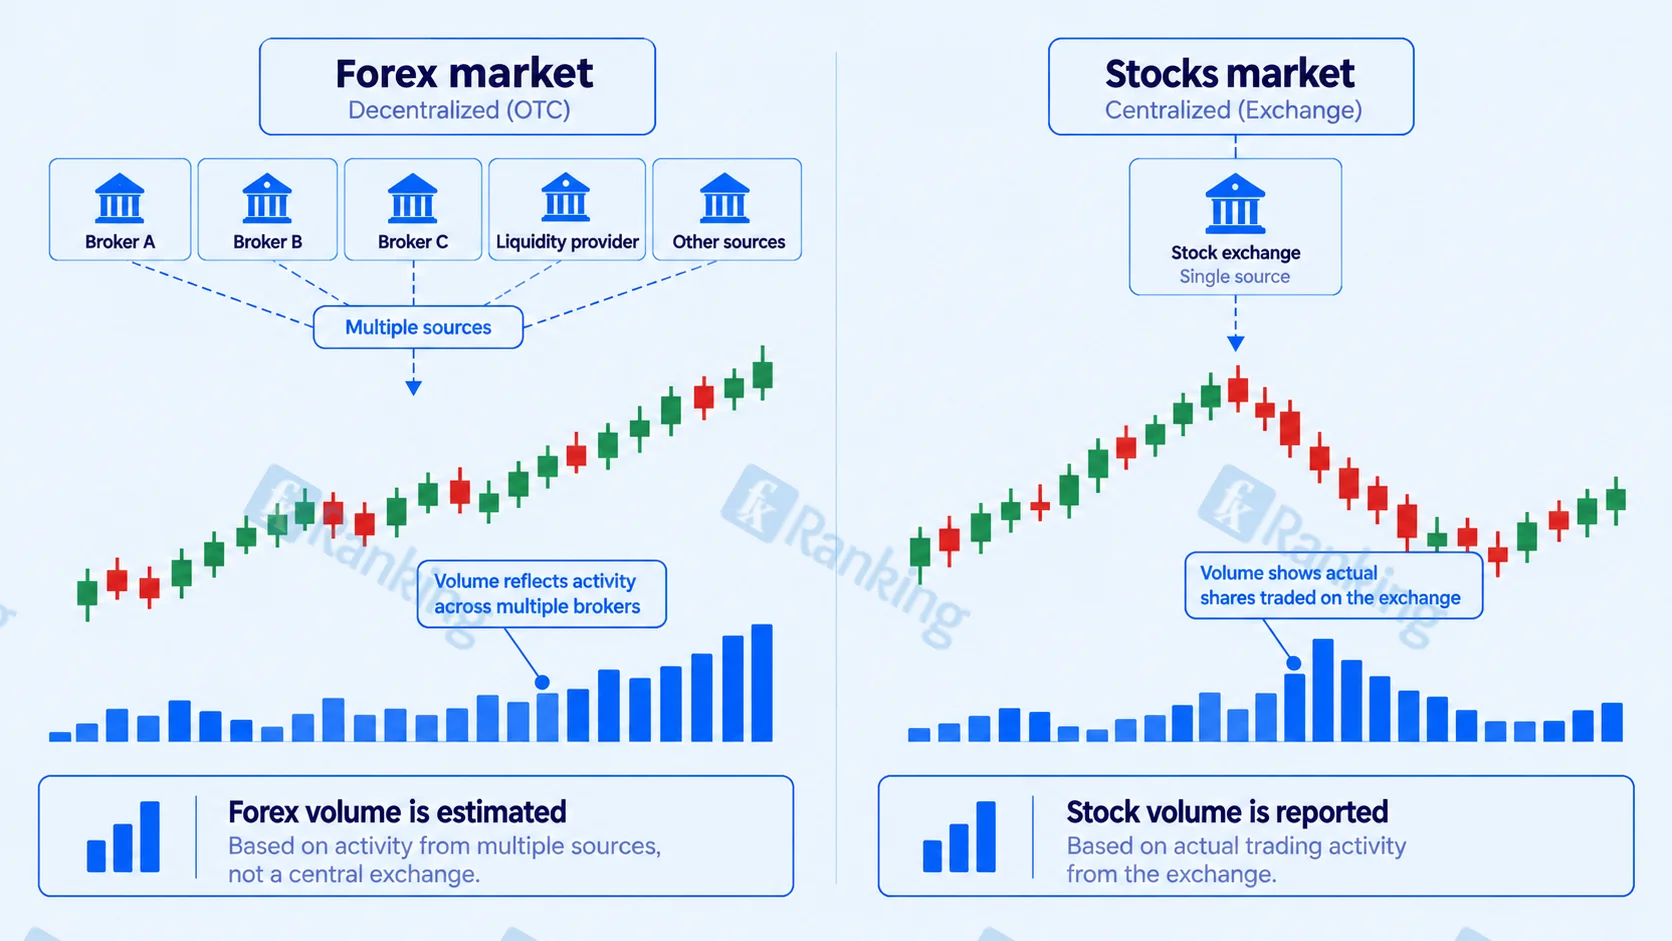
The main reason is market structure. Spot foreign exchange is a decentralized over-the-counter market. Trades take place through a network of banks, liquidity providers, electronic trading venues, brokers and other participants rather than through one central exchange that records every transaction.
There is therefore no single, market-wide volume number for the entire spot forex market. A retail trading platform receives a price feed from its own sources, so the volume displayed on a EUR/USD chart represents activity in that particular data feed rather than all EUR/USD trading worldwide.
This is different from an exchange-traded market. Currency futures, for example, are traded through centralized exchanges where contract volume can be recorded. Traders sometimes use this futures volume as an additional reference when studying activity in the corresponding currency market.
However, futures volume is not the same as total spot-forex volume. They are different markets with different instruments, participants and trading mechanics.
1. Tick Volume
Tick volume is the number of price or quote changes recorded during a candle. It is the type of volume most commonly encountered by retail forex traders, including on popular trading platforms.
Suppose a 15-minute EUR/USD candle shows a tick-volume reading of 800. That means the platform recorded 800 relevant price updates during those 15 minutes. It does not tell the trader whether 800 trades took place or whether a particular number of euros was exchanged.
Tick volume is therefore best viewed as a proxy for activity. A busy period tends to produce more price updates, while quieter periods may produce fewer. The reading becomes more useful when compared with previous candles from the same market and session rather than treated as an exact measure of money changing hands.
2. Real or Actual Volume
Some platforms and data feeds provide a field called real volume or actual volume. This represents traded quantity reported by the particular source supplying the data.
In spot forex, however, such a figure should not automatically be interpreted as total global market volume. If the data comes from a broker, liquidity provider or particular trading venue, it represents that source's activity or the quantity that source reports.
The practical question is therefore not simply whether a platform says "real volume." Traders should find out where the number comes from and what it actually measures.
3. Currency Futures Volume
Currency futures provide another source of volume information. Futures contracts for major currencies are traded on centralized exchanges, allowing the exchange to report the number of contracts traded.
Some traders use futures volume as a proxy for broader institutional activity in the corresponding currency pair. It can be useful because it comes from a centralized market, but it should not be confused with a complete measure of spot EUR/USD, GBP/USD or another currency pair.
The relationship between spot and futures markets is close, but they remain different markets. Futures volume can therefore provide additional context rather than a definitive measure of everything happening in spot forex.
4. Volume as Trade Size
There is another answer to the question "what does volume mean in forex trading?" Sometimes volume refers not to market activity at all, but to the size of an individual position.
Forex positions are commonly measured in lots. A standard lot is generally 100,000 units of the base currency, a mini lot is 10,000 units, and a micro lot is 1,000 units. Some platforms also support smaller position sizes.
For example, a trader placing a 0.10-lot EUR/USD position is choosing a position size of approximately 10,000 euros under the conventional lot system.
This meaning of volume is separate from the volume histogram displayed underneath a price chart. That distinction prevents a common misunderstanding: chart volume and trade size are not the same thing.
Why Does Volume Matter in Forex Trading?
If tick volume does not tell traders exactly how much money has changed hands, why use it at all?
The answer is that changes in activity can add context to price. A price move accompanied by unusually high activity can tell a different story from a similar-sized move that happens while activity is unusually low.
Three ideas are particularly useful: participation, the strength of a move and liquidity.
Participation refers to how active the market appears to be. When a major trading session opens or important economic news is released, price updates can increase sharply.
Strength concerns the relationship between activity and price movement. If EUR/USD breaks above resistance while volume rises noticeably compared with recent candles, some traders may regard that as evidence that the breakout has broader participation behind it.
Liquidity describes how easily orders can be executed without significantly moving the market. Volume does not directly measure liquidity, and high tick volume does not guarantee tight spreads or deep order books. Still, changes in activity can help traders identify periods when the market is particularly busy.
The key is to treat volume as additional evidence rather than a standalone signal.
How Traders Use Volume in Forex
1. Confirming Breakouts
One common use of volume in forex trading is to examine breakouts from established price levels.
Imagine EUR/USD has repeatedly struggled to move above 1.1000. If the pair finally closes above that level while tick volume rises substantially compared with recent candles, a trader may regard the move as more meaningful than a breakout that occurs on unusually low activity.
The reason is straightforward: the price has moved through a level while the market is showing increased activity. That does not prove the breakout will continue. It simply provides another piece of information alongside the candle structure, support and resistance, and broader market conditions.
2. Assessing Trend Strength
Volume can also help traders compare strong and weak stages of a trend.
For example, suppose GBP/USD is making a series of higher highs and higher lows. If upward candles repeatedly appear alongside relatively strong volume, a trader may see greater participation during the advance.
If price continues making new highs while volume steadily falls, the trend may deserve closer examination. This does not mean that declining volume automatically signals a reversal. Markets can trend for long periods with changing activity levels.
Volume is better used as context than as a prediction tool.
3. Spotting Weak Moves and Possible Exhaustion
A sharp price move with unusually high activity can sometimes indicate a period of intense buying or selling. If price then struggles to make further progress, traders may look for signs that the move is becoming exhausted.
For example, a currency pair could rise quickly into an established resistance area while volume spikes. If the next few candles fail to extend the move and price begins to reverse, the combination may warrant attention.
A volume spike on its own does not identify the end of a trend. News releases can create very high activity while a move continues for much longer than expected.
4. Looking for Volume Divergence
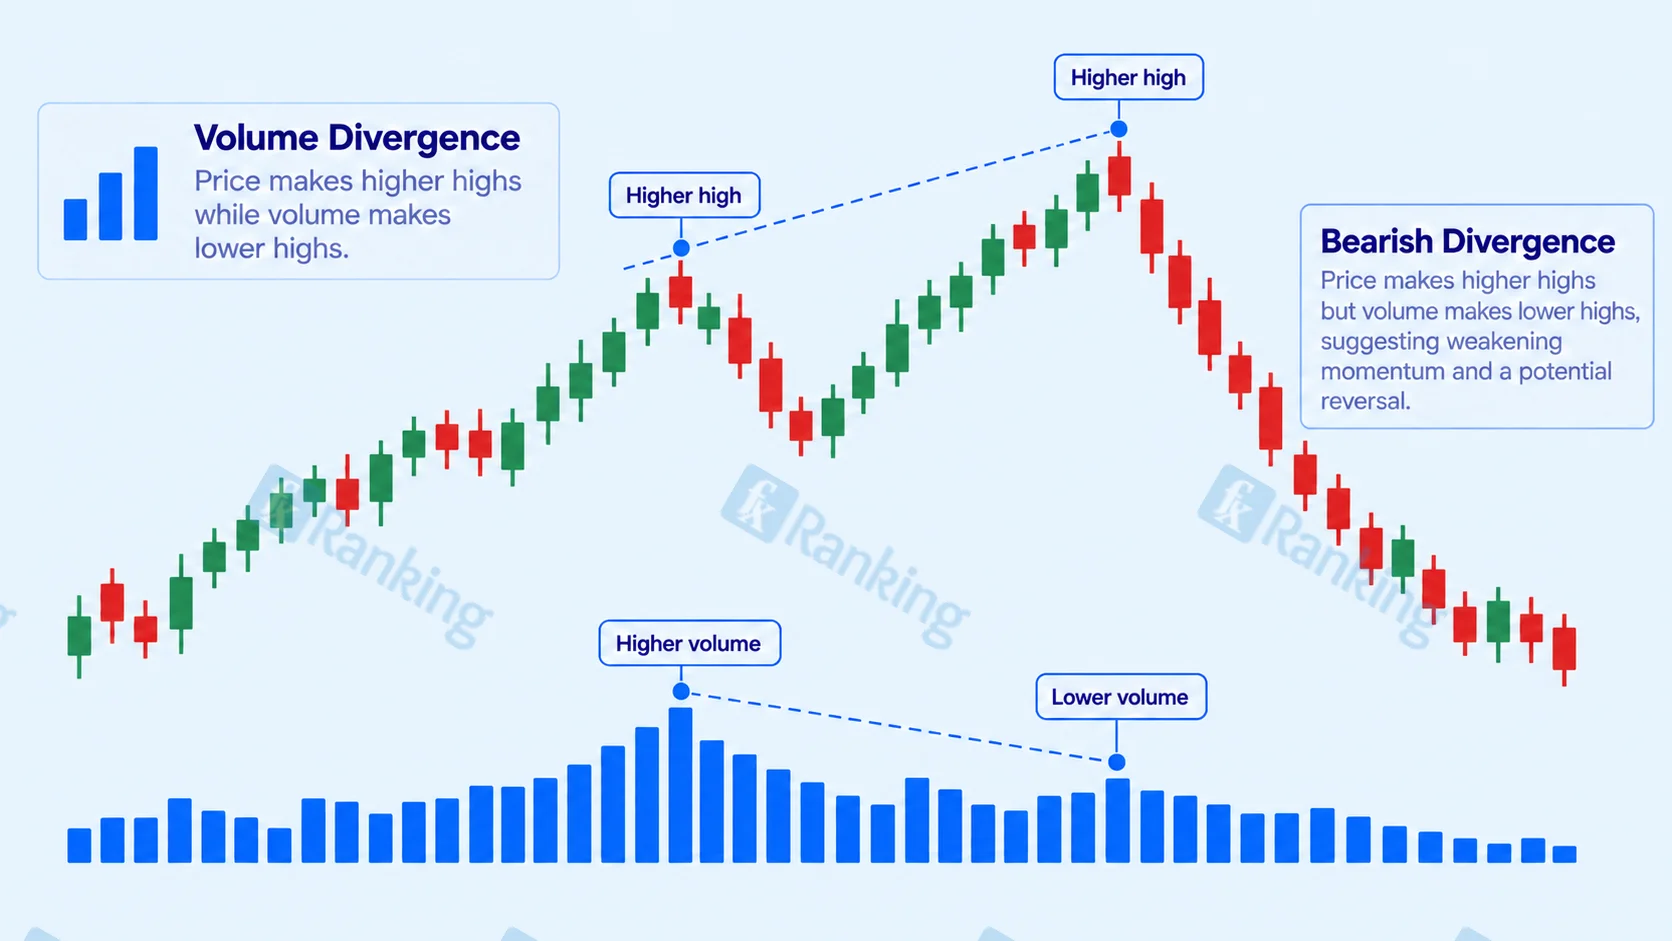
Volume divergence occurs when price and volume appear to tell different stories.
One example is price making a new high while the volume associated with the move is lower than during the previous high. Some traders interpret this as a warning that participation is not increasing with price.
The same idea can be examined during declines. If price reaches a new low but activity is noticeably weaker than during the previous sell-off, traders may question whether the latest move has the same degree of participation.
Divergence is a warning, not a trading instruction. A market can continue rising or falling despite declining volume.
5. Comparing Trading Sessions
Volume in forex changes naturally throughout the trading day.
The Asian session can have different activity characteristics from the London session, while the London-New York overlap often brings a substantial increase in activity in major currency pairs. The exact pattern depends on the currency pair and the economic calendar.
This means a trader should be careful when comparing volume readings from different sessions. A volume level that looks high during a normally quiet period may be ordinary during the London-New York overlap.
News can produce an even sharper change. An interest-rate decision, employment report or inflation release can cause a sudden increase in price updates.
The resulting volume spike tells traders that activity has increased, but it does not by itself reveal whether the next move will be higher or lower.
Common Volume Indicators
Several technical indicators incorporate volume into their calculations. Their usefulness depends heavily on what type of volume the underlying platform provides.
1. Volume Histogram
The basic volume histogram displays volume as vertical bars below the price chart. Traders can compare the current reading with recent bars to identify unusually active or quiet periods.
For spot forex, the histogram will commonly be based on tick volume. This makes it relatively simple to use, but the trader needs to remember that the bars reflect the platform's data feed rather than a consolidated global volume figure.
2. On-Balance Volume
On-Balance Volume, commonly called OBV, combines price direction with volume.
When the market closes higher, volume is generally added to the running OBV total. When it closes lower, volume is subtracted.
Traders may compare the direction of OBV with price to look for confirmation or divergence. In spot forex, however, OBV is normally working with tick volume rather than consolidated traded volume, so its interpretation needs the same qualification as the underlying data.
3. Volume Profile
Volume Profile displays activity by price level rather than simply by time. It can help traders see areas where the available volume data has been concentrated.
This concept is especially intuitive in futures, where exchange-reported contract volume is available. On spot forex charts, a Volume Profile built from tick volume is based on the broker or platform's feed, so levels can vary between data sources.
4. Money Flow Index
The Money Flow Index, or MFI, combines price and volume to estimate buying and selling pressure over a chosen period. It is sometimes described as a volume-weighted momentum oscillator.
MFI can be applied to forex, but the volume input matters. If the platform uses tick volume, the indicator is measuring price activity through that proxy rather than actual market-wide currency turnover.
5. Accumulation/Distribution
The Accumulation/Distribution indicator uses price and volume to assess whether buying or selling pressure is accumulating over time.
Traders may compare the indicator's direction with price to identify potential divergence.
Again, the limitation is the same: in spot forex, the volume component will generally be based on a particular data feed rather than the total global spot market.
6. VWAP
Volume-Weighted Average Price, or VWAP, calculates an average price weighted by volume. It is widely used in markets where reliable traded-volume data is available.
VWAP can also appear on forex platforms, but traders need to check what volume is being used. A VWAP calculated from spot-forex tick volume is not equivalent to a VWAP calculated from consolidated exchange-traded volume.
Futures-based VWAP can therefore provide a different dataset from a retail spot-forex VWAP.
Hypothetical Example: Volume Confirms a Breakout
Consider a hypothetical EUR/USD chart where price has tested 1.1000 several times without closing above it.
On the next attempt, a strong bullish candle closes above 1.1000. At the same time, tick volume is significantly higher than the average of the preceding candles.
A trader might regard the combination of a clean break and increased activity as stronger evidence of participation than the price breakout alone.
The trader would still need to consider whether the move occurred during a major news release, whether the candle closed convincingly above resistance, and where the next important price levels sit.
Now consider the opposite situation. EUR/USD briefly moves above 1.1000, but the breakout candle has unusually low tick volume and quickly closes back below the level.
That does not prove the breakout will fail, but it gives the trader a reason to question the move. If subsequent candles also fall back below resistance, the original breakout may have been a false break rather than the start of a sustained move.
The examples are hypothetical. Volume does not determine the outcome; it adds context to the price action.
Limitations of Volume in Forex
The biggest limitation is that tick volume is a proxy, not a complete measurement of global forex trading activity.
It counts price or quote changes in a particular data feed rather than every transaction taking place across the international currency market.
Different brokers and liquidity providers can therefore show different tick-volume readings for the same currency pair and time period. Their feeds may contain different prices, update frequencies and sources.
Two charts can look broadly similar while their volume histograms are not identical.
Volume also cannot tell traders everything about market intent. A spike can occur because of scheduled economic news, unexpected headlines, changes in liquidity or rapid repricing.
High volume does not automatically mean buyers are in control, just as low volume does not automatically mean a trend is about to reverse.
For these reasons, volume works best alongside price action, support and resistance, trend structure and risk management. A trader should avoid treating a single volume reading as a complete trading signal.
Common Mistakes When Using Volume in Forex
One common mistake is assuming that a volume bar represents the number of lots traded across the entire forex market. On a typical spot-forex chart, it does not. It is generally a count of price updates from the platform's feed.
Another mistake is comparing raw volume numbers between different brokers. A tick-volume reading of 2,000 from one feed is not necessarily directly comparable with 2,000 from another feed. Comparisons are more meaningful when the same data source, currency pair and timeframe are used.
Traders also sometimes assume that every volume spike is bullish or bearish. Volume measures activity, not direction. Price action is needed to establish whether the market actually moved higher, lower, or simply became more volatile.
Finally, relying on volume alone can create a false sense of certainty. A breakout with high volume can still fail, while a low-volume move can continue. Volume is most useful when it answers a specific question about price rather than being treated as a signal in isolation.
Conclusion
So, what is volume in forex? For most retail traders, it is primarily tick volume, a measure of how many price or quote changes occur during a particular period. Because spot forex is decentralized, there is no single consolidated volume figure covering the entire market.
Currency futures provide exchange-based volume data, while broker or liquidity-provider data may provide other forms of reported activity. Each type of data has a different meaning, so traders should understand the source before drawing conclusions from a volume indicator.
The practical value of volume comes from comparing activity with price. Rising volume can add context to a breakout or trend, while unusual declines or divergences can prompt closer analysis.
Used alongside price structure, support and resistance, and sensible risk management, volume can help traders understand market activity without pretending to provide information it cannot actually measure.
FAQs
Does volume matter in forex?
Yes, volume can provide useful context about market activity, particularly when comparing current activity with recent candles. However, spot-forex volume is usually tick volume rather than a consolidated count of transactions. Traders should therefore use volume alongside price action and other forms of analysis rather than treating it as a standalone measure of buying or selling pressure.
Is there real volume in forex?
There is traded-volume data from individual brokers, liquidity providers and trading venues, but there is no single consolidated volume figure for the global spot-forex market. Exchange-traded currency futures provide centralized volume data. A trader should check the source of any "real volume" figure to understand exactly what market or flow it represents.
What is the best volume indicator for forex?
There is no single volume indicator that is best for every trader or market condition. A basic volume histogram can show changes in activity, while OBV, Volume Profile, MFI and Accumulation/Distribution provide different ways of combining volume with price. Their interpretation depends on whether the underlying data is tick volume or actual traded volume.
What does volume mean in forex trading?
The term can have two meanings. On a price chart, volume usually refers to market activity during a candle, most often measured through tick volume. In the context of placing a trade, volume can instead mean position size, normally expressed in lots. These are different concepts and should not be confused.
How can traders use volume to confirm a forex breakout?
A trader may compare the volume on a breakout candle with recent activity. A breakout accompanied by noticeably higher tick volume can suggest greater participation than one occurring on unusually low activity. It does not guarantee that the breakout will hold, so traders should also examine the closing price, nearby support or resistance, market conditions and subsequent price action.

Stephen Bennet
Stephen Bennet is a Forex reviewer and financial analyst with more than 25 years of experience in the financial markets. He specializes in reviewing brokers, evaluating trading platforms, and explaining the Forex market in a clear and practical way. Through independent, trader-focused analysis, Stephen helps readers compare providers, understand key risks, and choose platforms with greater confidence.