
















































































































Best Volume Indicators for Forex Trading
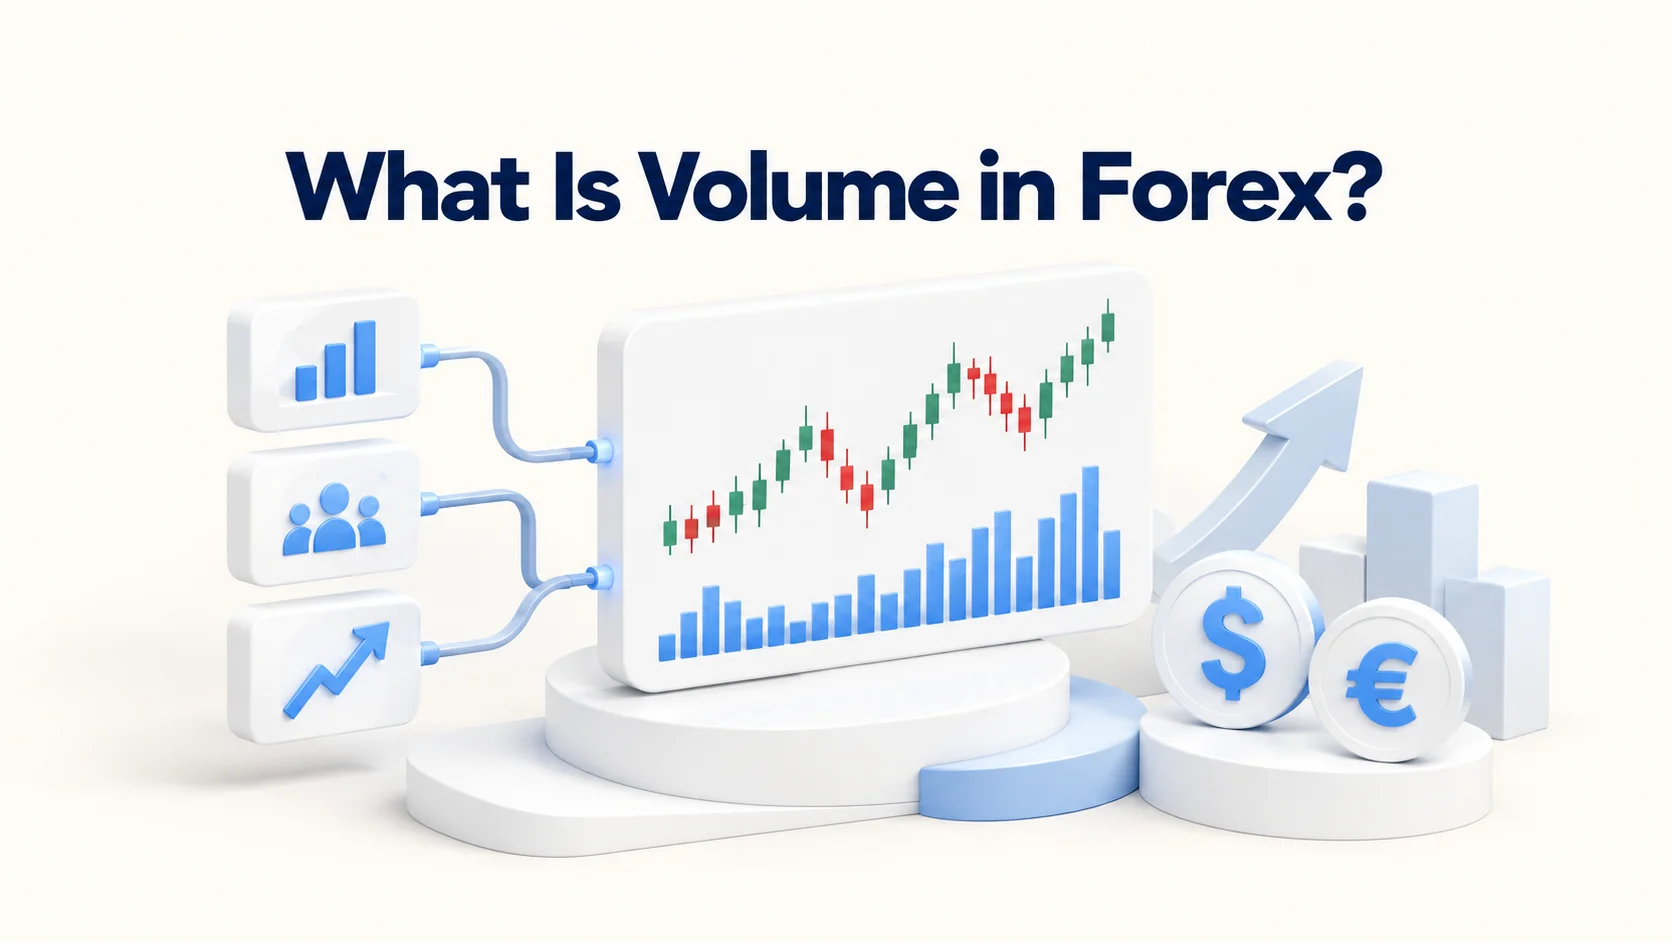
Volume indicators measure market activity and help traders evaluate the strength behind price movement. In forex, however, volume works differently from centralized markets such as stocks and futures.
The spot forex market has no single exchange recording every transaction. Most retail trading platforms therefore display tick volume, which counts price changes during a given period rather than the total number of currency units traded.
Tick volume remains useful because it shows changes in activity on the price feed being analysed. Volume indicators use that information to evaluate momentum, divergence, trend confirmation, and changes in trading intensity.
This guide explains the main volume indicators used in forex trading, how each one works, what its signals represent, and how to use volume correctly in a decentralized market.
How Volume Works in Forex
Forex volume has to be understood differently from stock-market volume.
A centralized stock exchange records executed transactions through one venue. Spot forex trading takes place across a global network of banks, brokers, and liquidity providers, so no single data source records every EURUSD, GBPUSD or USDJPY transaction worldwide.
What Is Tick Volume?
Tick volume measures the number of price changes recorded during a candle or other defined period.
If EURUSD records more quote changes during one five-minute candle than another, the first candle has higher tick volume.
Tick volume therefore measures price-update activity. It does not measure the exact number of contracts, lots or currency units exchanged across the entire forex market.
Most retail forex volume indicators operate on this tick-volume data.
Tick Volume vs Real Volume
| Measure | What It Records | Main Use |
|---|---|---|
| Tick Volume | Number of price changes recorded by the trading feed | Measures relative market activity |
| Real Volume | Actual executed contracts or transaction size | Measures executed trading activity on the relevant venue |
Real executed-volume data exists in centralized markets and in trading products linked to specific exchanges or execution venues.
Retail spot forex charts generally use tick volume instead.
This distinction affects how volume indicators should be interpreted. Forex volume readings describe relative activity on the available feed, not the total amount of money traded globally.
Why Forex Volume Data Differs Between Brokers
Tick volume comes from the broker or liquidity feed supplying the price data.
Different brokers receive different quote streams, so raw tick-volume values do not represent a universal forex-market total.
This makes relative comparison more useful than absolute comparison. Traders should compare volume behaviour within the same instrument and data feed rather than treating a raw volume number as a global market statistic.
Best Volume Indicators for Forex Trading
1. On-Balance Volume (OBV)
On-Balance Volume is a cumulative indicator that links directional price closes with volume activity.
When the current period closes above the previous period, OBV adds the period's volume. When price closes lower, OBV subtracts the period's volume.
This produces a cumulative line that shows whether volume activity is generally moving in the same direction as price.
What OBV Shows
OBV is particularly useful for identifying divergence.
If price continues to make higher highs while OBV fails to make corresponding highs, price and volume activity are moving out of alignment.
The same principle applies in a downtrend when price reaches new lows while OBV stops confirming the decline.
OBV Limitation
The absolute OBV number has little analytical value by itself because the indicator is cumulative.
The direction of the OBV line and its relationship with price provide the useful information.
2. Volume Weighted Average Price (VWAP)
Volume Weighted Average Price calculates the average traded price over a defined session while assigning greater weight to periods with higher volume.
On retail spot forex platforms, VWAP typically uses tick volume rather than centralized executed volume.
The resulting line acts as a session-based reference price.
What VWAP Shows
Price above VWAP trades above the session's volume-weighted average price. Price below VWAP trades below that reference.
Intraday traders use VWAP to evaluate relative session strength, execution location and potential support or resistance around the weighted average.
VWAP Limitation
VWAP normally resets at the start of a new session.
This makes it primarily an intraday tool rather than a long-term trend indicator.
Forex VWAP also inherits the limitations of the tick-volume feed used in its calculation.
3. Chaikin Money Flow (CMF)
Chaikin Money Flow combines volume with the location of each candle's close inside its high-low range.
The indicator calculates these values across a defined lookback period, commonly 20 or 21 periods, and oscillates around a zero line.
What CMF Shows
Positive CMF values show that price is consistently closing toward the upper part of its range while volume activity remains supportive.
Negative values show greater activity associated with closes toward the lower part of the trading range.
Traders use CMF to confirm whether volume behaviour supports an existing price trend.
CMF Limitation
CMF produces frequent changes around the zero line during choppy markets.
The indicator provides clearer information when it is read alongside an established price trend rather than as an isolated entry signal.
4. Volume Oscillator
The Volume Oscillator measures the difference between a short-term moving average of volume and a longer-term moving average of volume.
The principle resembles a momentum oscillator applied to market activity rather than to price.
What the Volume Oscillator Shows
A rising Volume Oscillator shows that recent volume activity is increasing relative to its longer-term average.
A falling reading shows that recent activity is contracting.
Traders use this information to determine whether market participation is expanding or fading during a price move.
Volume Oscillator Limitation
The indicator measures changes in volume activity, not market direction.
Rising volume occurs during both bullish and bearish price moves, so the oscillator must be interpreted together with price action.
5. Money Flow Index (MFI)
The Money Flow Index combines price and volume into an oscillator ranging from 0 to 100.
It is often compared with RSI because both indicators measure momentum through an oscillator structure. MFI adds volume to the calculation.
Common reference levels are 80 for overbought conditions and 20 for oversold conditions.
What MFI Shows
MFI measures the relationship between price movement and volume activity.
Traders use it to study overbought and oversold conditions, momentum and divergence between price and money-flow behaviour.
MFI Limitation
Overbought does not automatically mean that price will fall, and oversold does not automatically mean that price will rise.
During a strong trend, MFI can remain above 80 or below 20 for an extended period.
The indicator therefore works more effectively as a momentum and confirmation tool than as an automatic reversal signal.
6. Accumulation/Distribution Line
The Accumulation/Distribution Line combines volume with the location of the closing price inside each candle's high-low range.
A close near the top of the range contributes more positively to the indicator, while a close near the bottom contributes more negatively.
What the Accumulation/Distribution Line Shows
The indicator tracks whether volume behaviour is broadly supporting upward or downward price movement over time.
Like OBV, one of its main applications is divergence analysis.
Price moving in one direction while the A/D line moves in another signals a loss of confirmation between price and underlying volume behaviour.
Accumulation/Distribution Limitation
The indicator is cumulative and reacts more slowly than short-term momentum oscillators.
Its main value comes from trend confirmation and divergence rather than precise short-term entry timing.
7. Klinger Volume Oscillator
The Klinger Volume Oscillator combines price trend and volume information to track longer-term changes in volume force.
The indicator compares faster and slower components and uses a signal line to highlight changes in momentum.
What the Klinger Volume Oscillator Shows
Traders use the Klinger oscillator to analyse longer-term changes in volume behaviour, trend confirmation and divergence.
Crosses between the oscillator and its signal line also provide information about changes in volume momentum.
Klinger Volume Oscillator Limitation
The Klinger oscillator is more complex than OBV, VWAP or the basic Volume Oscillator.
Its additional calculations create more signals and require the indicator to be interpreted in the context of the underlying price trend.
How to Use Volume Indicators in Forex Trading
Volume indicators are most effective when they answer a specific question about market activity.
Confirm Price Movement
Volume provides context for price movement.
A strong price move accompanied by expanding volume activity shows that the move is occurring alongside increasing market activity.
A price move accompanied by contracting volume shows weakening activity behind the movement.
Volume confirmation should support an existing price analysis rather than replace it.
Identify Divergence
Divergence occurs when price and a volume indicator stop moving in the same direction.
For example, price can reach a new high while OBV or the Accumulation/Distribution Line remains below its previous high.
This shows that the latest price extension is not being confirmed by the same pattern of volume activity.
Divergence acts as a warning condition. It is not an automatic reversal signal.
Measure Expanding and Contracting Activity
Volume indicators help distinguish between periods of increasing and decreasing market activity.
This is particularly useful during breakouts, trend continuation, and consolidation.
Expanding activity during a breakout provides stronger confirmation than a breakout occurring while volume activity contracts.
Use Volume With Forex Market Sessions
Forex trading activity changes throughout the global trading day.
Major sessions such as London and New York generate different levels of quote activity from quieter trading periods.
Volume readings should therefore be interpreted in the context of the session being traded rather than compared blindly across unrelated periods of the day.
Compare Volume on the Same Data Feed
Tick volume belongs to the price feed producing it.
Raw volume values from different brokers should not be treated as identical market measurements.
The cleanest comparison uses the same broker feed, currency pair, and timeframe so changes in the indicator reflect changes inside the same dataset.
Which Volume Indicator Fits Each Trading Goal?
| Trading Goal | Indicator | Main Function |
|---|---|---|
| Identify price-volume divergence | On-Balance Volume (OBV) | Compares cumulative volume direction with price |
| Measure intraday price relative to volume | VWAP | Provides a session-based volume-weighted reference price |
| Confirm trend pressure | Chaikin Money Flow (CMF) | Combines closing location and volume over a lookback period |
| Measure expanding or contracting activity | Volume Oscillator | Compares short-term and long-term volume averages |
| Combine volume with overbought and oversold analysis | Money Flow Index (MFI) | Combines price and volume in a 0–100 oscillator |
| Track longer-term accumulation and distribution | Accumulation/Distribution Line | Combines candle closing position with volume activity |
| Analyse longer-term changes in volume momentum | Klinger Volume Oscillator | Combines price trend and volume-force calculations |
The appropriate indicator is determined by the information the trader needs.
OBV and the Accumulation/Distribution Line focus heavily on divergence. VWAP provides an intraday reference price. CMF and MFI combine price behaviour with volume activity. The Volume Oscillator focuses on changes in activity, while the Klinger Volume Oscillator examines longer-term volume momentum.
Using two indicators that answer the same question usually adds repetition rather than information. A stronger approach combines tools with different functions, such as one indicator for market activity and another for price structure.
What Volume Indicators Teach About Forex Market Activity
Volume indicators provide useful market context, but forex traders need to understand exactly what the underlying data represents.
First, spot forex volume is primarily tick volume. It measures price-update activity on a specific feed rather than total global transaction size.
Second, volume and direction are different measurements. Rising volume shows increasing activity. Price action determines whether that activity is occurring during an upward or downward move.
Third, divergence is a warning rather than a prediction. A disagreement between price and volume shows that the two measurements are no longer confirming each other. It does not determine the exact timing or direction of the next move.
Fourth, session context matters. Forex activity changes throughout the trading day, so volume readings should be compared with similar periods rather than treated as independent of market hours.
Fifth, raw tick-volume values are feed-specific. Relative changes within one broker feed provide more useful information than comparing absolute numbers across different brokers.
The central principle is straightforward: volume indicators measure the strength and character of market activity. They become most useful when combined with price structure, trend analysis, and a clear understanding of the data behind the indicator.
FAQs
What Is the Best Volume Indicator for Forex Trading?
Does Forex Have Real Volume Data?
What Is Tick Volume in Forex?
Is Tick Volume Useful for Forex Trading?
Yes. Tick volume provides a relative measure of market activity. Traders use it to analyse changes in momentum, confirm price movement and identify divergence.
Can Volume Indicators Predict Forex Price Direction?
What Is the Difference Between OBV and VWAP?

Jake Robins
Jake Robins is a Forex and cryptocurrency education contributor with over 10 years of experience helping readers better understand the financial markets. His work covers risk management, technical analysis, trading psychology, broker platforms, and scam awareness. Through clear, practical guidance, Jake helps traders approach the markets with greater discipline, caution, and confidence.