
























































































































What Is US30 in Forex?
US30 is a common broker label for a trading instrument linked to the Dow Jones Industrial Average (DJIA), often called the Dow. The Dow is a price-weighted stock-market index made up of 30 large US companies.
If US30 is quoted at 46,000, that represents the approximate index level tracked by the product. A rise from 46,000 to 46,150 is a 150-point increase, while a fall to 45,800 is a 200-point decline.
The monetary effect of those movements depends on the trader's position size and the broker's contract specifications.
Is US30 Really Forex?
No. US30 is not a traditional forex pair. A pair such as EUR/USD compares two currencies, while US30 tracks a US stock-market index. It is associated with forex because many retail brokers offer index products on the same platforms used for currency trading.
So, when asking what US30 forex is, the key distinction is simple: US30 is an equity-index product commonly traded on forex-style platforms, not a currency pair.
What Does the US30 Track?
The underlying benchmark is the Dow Jones Industrial Average. The Dow contains 30 major US companies and covers several areas of the economy. Unlike many stock indices, it is price-weighted.
This means companies with higher share prices generally have more influence on the Dow's movements than companies with lower share prices. That differs from market-capitalisation-weighted indices, where company size determines the weight.
The calculation can be simplified as:
Combined prices of Dow components ÷ Dow divisor = index level
The divisor is adjusted for events such as stock splits and changes to index membership so those events do not create artificial jumps in the index.
How Is US30 Traded on Forex Platforms?
When traders buy or sell forex US30, they are generally speculating on changes in the index price rather than purchasing shares in all 30 Dow companies.
A trader expecting the index to rise may open a long or buy position. A trader expecting it to fall may open a short or sell position.
For example, if US30 rises from 46,000 to 46,120, that is a 120-point favorable move for a long position. A fall from 46,000 to 45,900 would be a 100-point adverse move.
The monetary profit or loss depends on the contract's point value and the position size.
What Is the US30 Forex Symbol?
There is no universal US30 forex symbol. Depending on the broker, a Dow-linked product may appear as:
- US30
- US 30
- DJ30
- Wall Street
- Dow 30
- A broker-specific variation
These should not automatically be confused with YM, the ticker for CME E-mini Dow futures. An exchange-traded Dow futures contract and a broker's US30 product can have different contract specifications, trading hours, and point values.
Understanding US30 Points and Position Size
US30 movements are normally measured in points.
If the index moves from 46,000 to 46,050, that is a 50-point move.
Its monetary value depends on the contract:
Profit or loss = points moved × value per point × position size
For example, if a position is worth $1 per index point, a 50-point move represents approximately:
50 × $1 = $50
Note that this is only an example. Point values vary between products.
Before trading, check the broker's contract size, minimum position size, value per point, margin requirement, leverage, spread, financing charges, and trading hours.
What Moves US30?
US30 responds to expectations about economic growth, corporate profits, interest rates, monetary policy, and investor risk appetite.
Federal Reserve Policy and Interest Rates
Federal Reserve decisions can influence US30 because interest rates affect borrowing costs, company valuations, economic activity, and investor demand for equities.
Markets often react not only to whether the Fed changes rates, but also to what policymakers signal about future policy. A decision that is more hawkish or dovish than expected can therefore cause sharp movements in major US indices.
Treasury Yields
Government bond yields influence the relative attractiveness of stocks compared with fixed-income assets. Rapidly rising yields can put pressure on equity valuations, although the relationship is not automatic.
The effect also depends on why yields are moving. Rising yields caused by improving economic expectations can produce a different market reaction from rising yields caused by unexpectedly persistent inflation.
US Economic Data
Inflation, employment, growth, and consumer-spending reports can move US30 by changing expectations for the economy and Federal Reserve policy.
Markets often react more to how the result compares with forecasts than to whether the headline appears simply "good" or "bad."
Corporate Earnings
Because the Dow consists of individual companies, earnings announcements from its components can influence the index.
The price-weighted structure is especially relevant here: large price movements in higher-priced Dow stocks can have a greater effect on the index than similar percentage movements in lower-priced components.
Market Sentiment and Global Risk
US30 can also respond to financial stress, geopolitical developments, changes in commodity prices, political uncertainty, or sudden shifts in global investor confidence.
Stronger risk appetite may support equities, while defensive conditions can create selling pressure, although neither relationship is guaranteed.
When Is the Best Time to Trade US30?
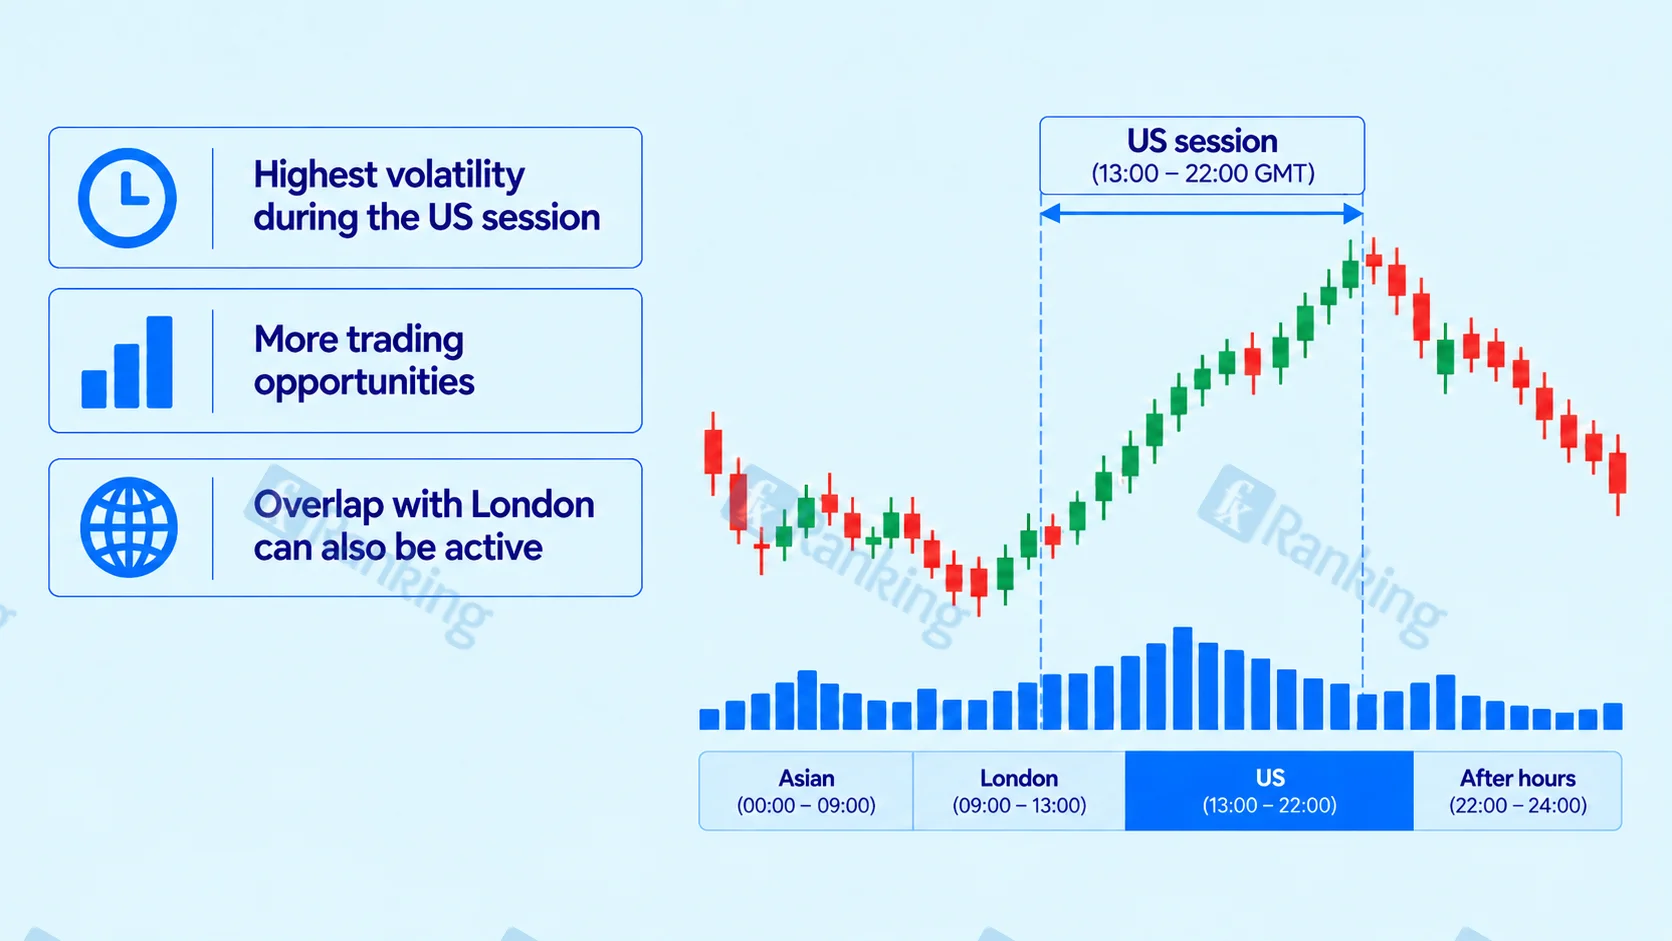
The underlying US stock market's core session runs from 9:30 a.m. to 4:00 p.m. Eastern Time.
The market open can be especially active as traders react to overnight news and accumulated orders. Major US economic releases can also increase volatility before or during the session.
US30 Outside Regular Stock-Market Hours
Some Dow-linked products trade outside the main equity session. Dow futures trade for much of the trading day, and some brokers offer extended US30 CFD hours.
Traders should therefore distinguish between the underlying stock-market session, futures hours, and their broker's US30 hours. Liquidity and spreads can vary between them.
How Traders Analyze US30
Traders commonly combine fundamental analysis, technical analysis, and market sentiment.
Fundamental Analysis
Fundamental analysis considers factors such as Federal Reserve policy, Treasury yields, inflation, economic growth, company performance, and investor risk appetite.
Technical Analysis
Technical analysis focuses on price behavior using tools such as:
- Support and resistance
- Previous highs and lows
- Trend structure
- Breakouts and pullbacks
- Moving averages
- Momentum indicators
These tools do not guarantee the next move. They help traders identify possible entries and exits and determine where a trading idea becomes invalid.
Trading US30 With Support and Resistance
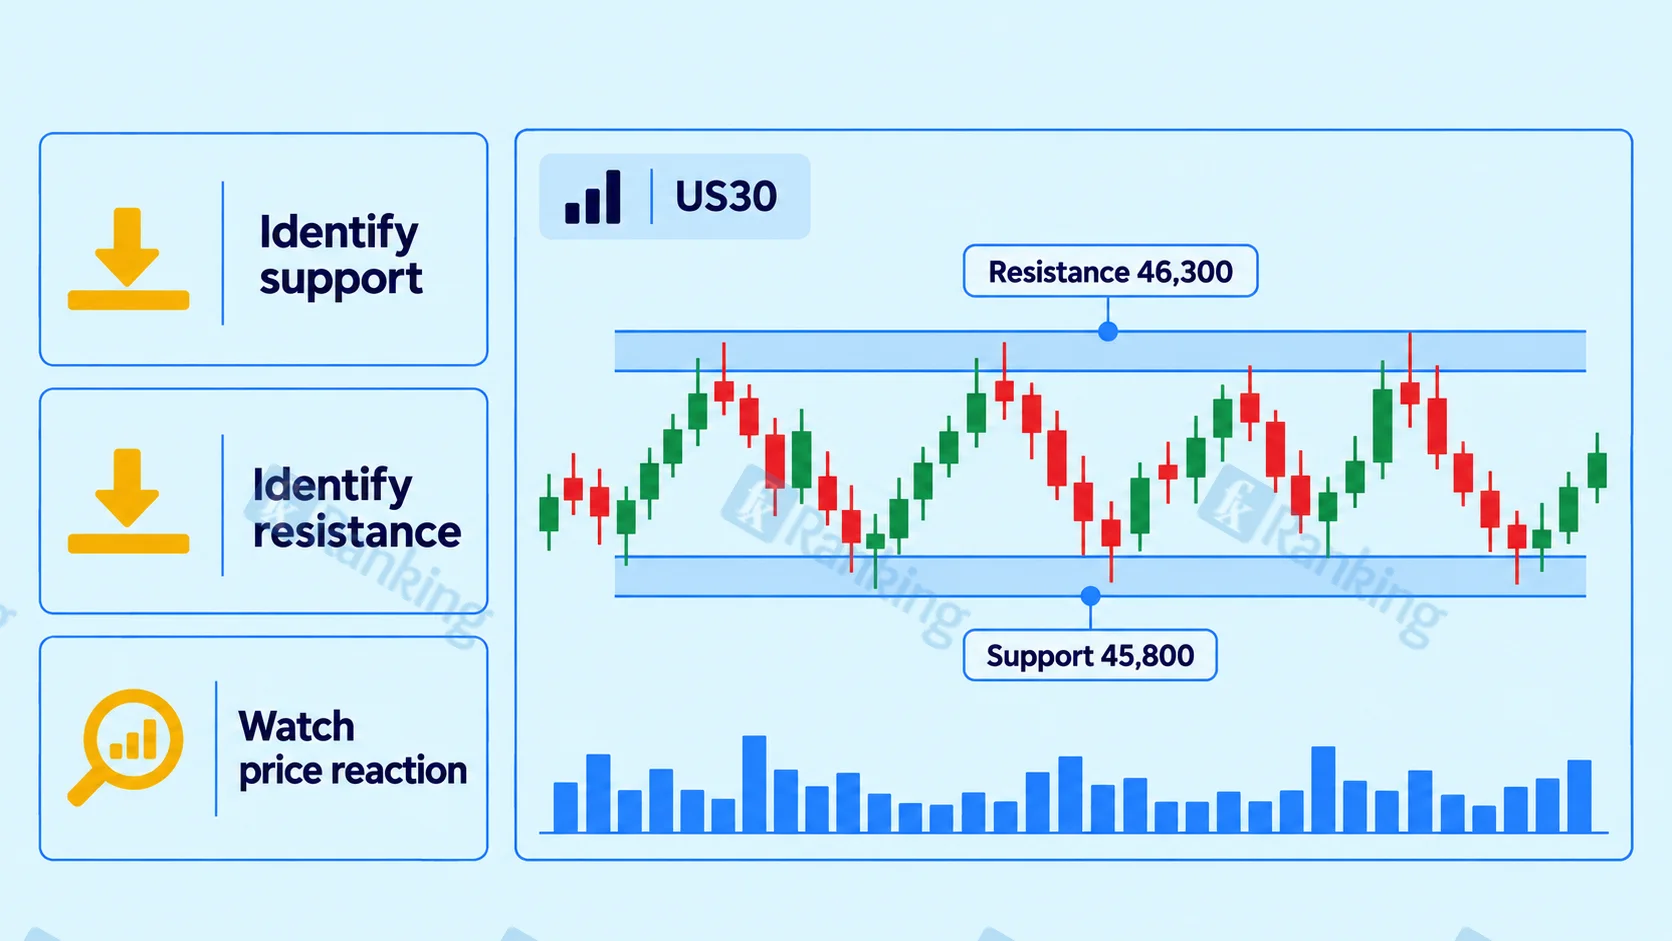
Support is an area where buying has previously slowed or reversed a decline, while resistance is an area where selling has slowed or reversed an advance.
Suppose US30 repeatedly falls toward 45,800 and rebounds. Traders may view that area as potential support. If the index repeatedly rises toward 46,300 before falling, that area may be treated as resistance.
Traders can then watch how price behaves when it returns to those zones.
US30 Breakouts, Trends, and Pullbacks
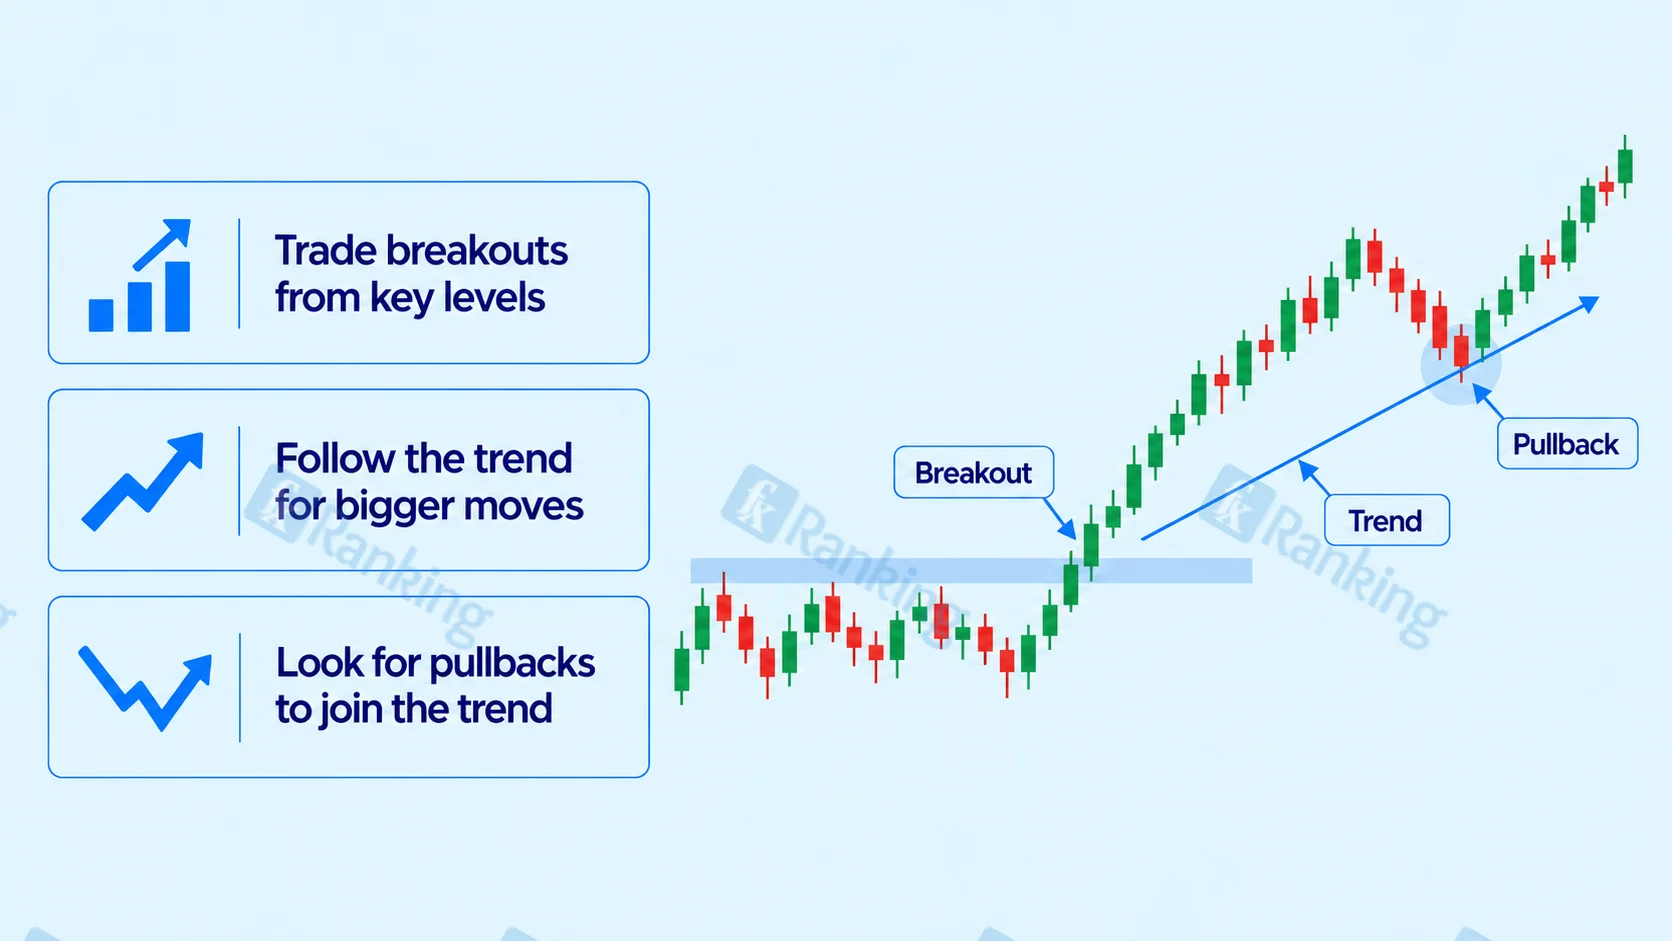
A breakout occurs when price moves beyond an established trading range.
If US30 trades between 45,900 support and 46,200 resistance, a move above 46,200 may signal a bullish breakout, while a move below 45,900 may signal a bearish one. Breakouts can fail, so traders may look for confirmation such as a close beyond the level, strong momentum, or a retest.
An uptrend generally forms higher highs and higher lows, while a downtrend forms lower highs and lower lows. Instead of entering after an extended move, some traders wait for a pullback toward a previous support, resistance, or breakout area.
Risk Management When Trading US30
US30 can move rapidly around the US market open, economic announcements, company news, and unexpected global events.
Define Account Risk
Decide the maximum amount or percentage of the account that can be lost if the setup fails.
Match Position Size to the Stop
A wider stop generally requires a smaller position to keep account risk unchanged. The stop itself should reflect where the trading idea becomes invalid.
Understand Leverage
Leverage allows traders to control larger positions with less deposited capital, magnifying both gains and losses.
Account for Slippage
During fast markets, an order may execute at a different price from the requested level. A Stop Loss therefore limits intended risk but does not guarantee the exact execution price.
Important Economic Events for US30 Traders
US30 traders should monitor major US events including:
- Federal Reserve decisions and speeches
- CPI and PCE inflation
- Nonfarm Payrolls and unemployment
- GDP
- Retail sales
- PMI reports
Corporate earnings and major announcements from Dow components can also move the index.
The market reaction often depends on how new information differs from expectations rather than simply whether a headline appears positive or negative.
Common Mistakes When Trading US30
Using Too Much Leverage
Large positions can turn ordinary index volatility into substantial account losses.
Ignoring the Contract Specification
Assuming every broker values one US30 point in the same way can produce major position-sizing errors.
Chasing the US Market Open
The opening period can move quickly. Entering simply because the index suddenly accelerates can mean buying near a temporary high or selling near a temporary low.
Ignoring Economic News
US30 can react sharply to inflation, employment, Federal Reserve, and growth data. A technically attractive setup can change rapidly when important information reaches the market.
Treating US30 Like a Currency Pair
The Dow and forex pairs can appear on the same platform, but their underlying drivers differ. US30 reflects a portfolio of US equities rather than the relative value of two currencies.
Moving Stops to Avoid a Loss
Moving a protective stop farther away after the market turns against a position increases the original risk instead of managing it.
Advantages and Limitations of US30 Trading
US30 gives traders exposure to a major US equity benchmark through a single instrument. It is widely followed, responds to important economic and corporate developments, and can be analyzed using both technical and fundamental methods. Many retail products also allow traders to speculate on either rising or falling prices.
However, these features do not make US30 easy to trade. The index can move rapidly, leverage can magnify losses, and contract conditions vary between brokers. Spread changes, overnight financing, slippage, and market gaps can also affect results.
The Dow's price-weighted methodology also means it should not be interpreted as though every company or every dollar of market value has equal influence.
What Is US30 in Forex? Key Takeaways
- US30 is a common broker label for a product linked to the Dow Jones Industrial Average.
- The Dow contains 30 major US companies and is a price-weighted stock index, not a currency pair.
- Broker symbols can include US30, DJ30, Wall Street, and other variations.
- Federal Reserve policy, Treasury yields, economic data, corporate earnings, and investor sentiment can influence the index.
- US30 movements are measured in points, but point values and contract specifications vary by product.
- Support and resistance, trends, pullbacks, and breakouts are common technical tools.
- Position size should be based on planned risk and stop distance.
Conclusion
Understanding what US30 is in forex starts with recognizing that the instrument is linked to the Dow Jones Industrial Average rather than to a currency pair.
The Dow tracks 30 major US companies using a price-weighted methodology, and traders can gain exposure to its movement through products offered by brokers or through exchange-traded derivatives such as futures.
US30 can react strongly to Federal Reserve policy, economic data, Treasury yields, company earnings, and changes in market sentiment. Technical analysis can help identify potential trading areas, but the effect of any movement on an account ultimately depends on contract size and position size.
The priority is therefore to understand the exact product being traded, calculate risk before entering, and treat US30 as an equity-index market rather than simply another symbol on a forex platform.
FAQs
What is US30 in forex?
US30 is a common broker label for a trading product linked to the Dow Jones Industrial Average (DJIA), a price-weighted index of 30 major US companies.
Is US30 a forex pair or an index?
US30 is an index-based trading product rather than a currency pair. It tracks movements related to the Dow Jones Industrial Average and is often offered on platforms that also provide forex trading.
What is the US30 forex symbol?
There is no universal symbol for the Dow-linked product. Depending on the broker, it may appear as US30, US 30, DJ30, Wall Street, or another broker-specific name.
What moves the US30 price?
US30 can be affected by Federal Reserve policy, interest rates, Treasury yields, US economic data, corporate earnings, geopolitical developments, and changes in investor sentiment.
When is US30 most active?
US30 activity is often highest around the opening of the US stock market at 9:30 a.m. Eastern Time and during major US economic announcements. Trading hours can vary depending on the broker and product.
How is US30 position size calculated?
Position size depends on the amount you are willing to risk, your stop-loss distance, and the broker's value per index point. Contract specifications differ between brokers, so traders should check the exact US30 product before calculating position size.

Nathan Wong
Nathan Wong is a Forex education contributor with 15 years of trading and market-analysis experience. He specializes in broker platforms, cryptocurrency, risk management, and trading psychology, creating practical content that helps readers make informed decisions and develop realistic expectations.